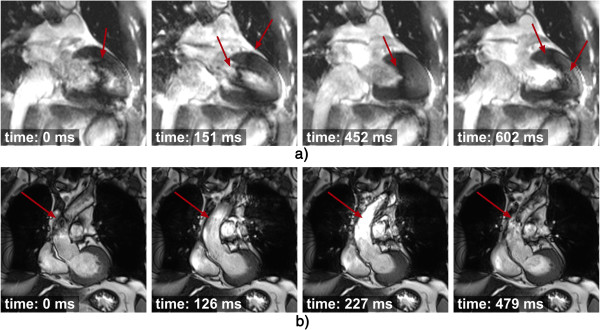
Figure 38.

bSSFP and B0 inhomogeneities: blood flow and dark bands. Two bSSFP cines with two examples of off-resonance artefacts and the effects of blood flow, the acquisition time after the R wave is also shown for each image. a) A dark band is visible in the heart (arrows), its position varies throughout the heart cycle due to myocardial motion and blood flow. b) Dark banding and signal intensity variations are visible in the ascending aorta (arrows) due to a dark band in the proximity of the image plane. Its effects are brought into the image plane by the flowing blood in the ascending aorta.
