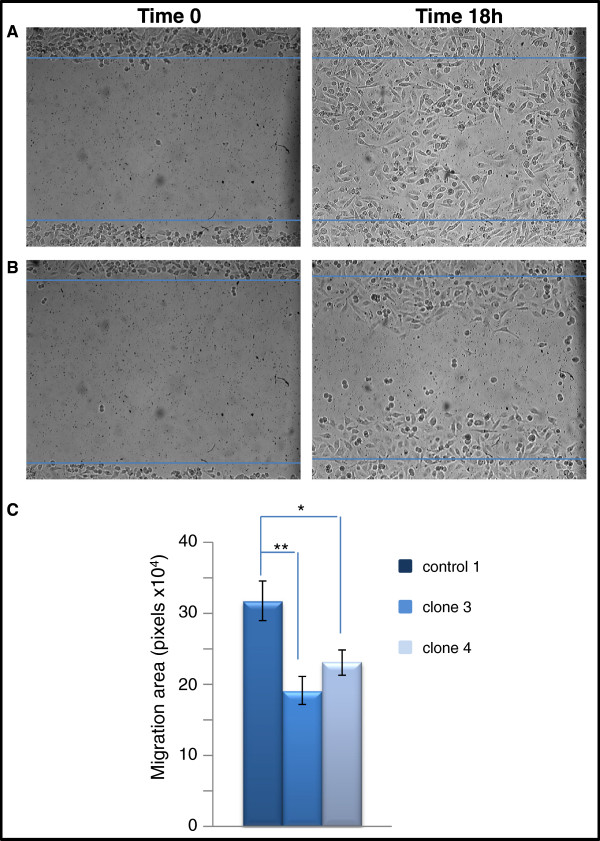
Figure 5.
Claudin 1 knockdown results in a decrease in cell migration rate in the BT-20 HBC cell line. Representative light microscopic images of wound healing assays for claudin 1 knocked-down and control BT-20 cells used in evaluating migration rate into a cell free area are shown. Cells were grown to confluency and a scratch made through the cell monolayer. Measurements of the wound areas at time 0 (left panels) and 18h (right panels) were compared using the Image-J program which measured the surface area covered by migrating cells. A. BT-20 cells stably transfected with the control sh-RNA sequence; B. BT-20 cells stably transfected with the sh-RNA-claudin 1 vector. C. BT-20 cells stably transfected with a control shRNA sequence (control 1, n=12) migrated faster than the claudin 1 knockdown clones (clone 3, n=8; clone 4, n=12; mean ± S.E; ANOVA p=0.0054).* p<0.05, **p,0.01 Bonferroni’s Multiple Comparison Test.

