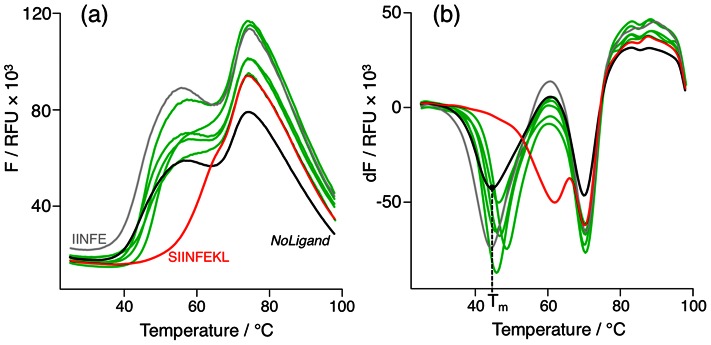
Figure 6.

(a) Melting curves of peptide-MHC-I (H-2Kb:IgG fusion protein) complexes depicting the normalized fluorescence F in relative fluorescence units (RFU) for SIINFEKL and NoLigand as positive (red line) and negative (black line) controls, an exemplary epitope fragment (INFE) showing no melting point shift (grey line) and all epitope fragments (IINFEKL, SIINF, INFEKL, SIINFEK, SIINFE) leading to a significant melting point shift (green lines). (b) Analogously the first derivative of F (dF) reveals the melting points as local minima, with T m denoting the presumable MHC-I heavy chain melting point in the absence of peptide ligand (NoLigand).
