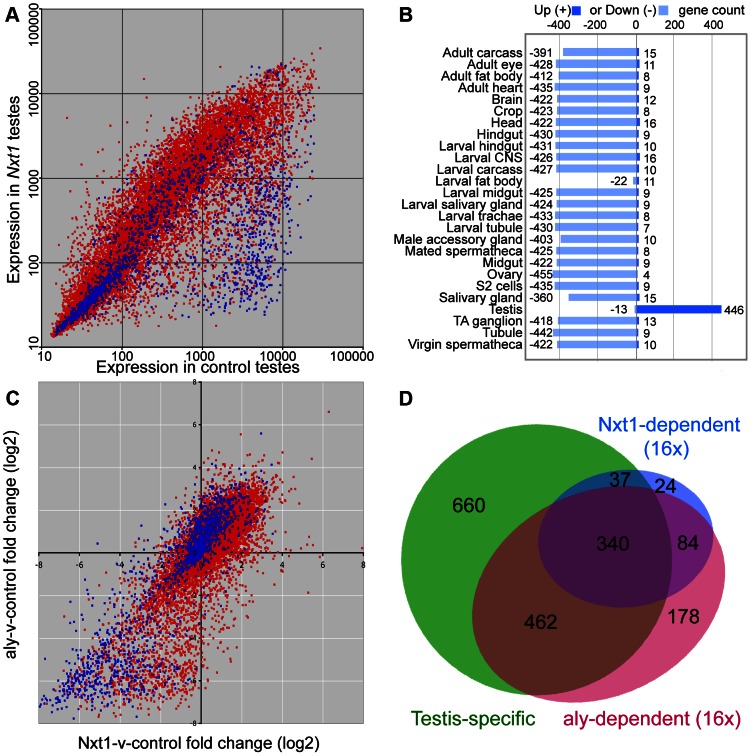
Figure 6. Microarray analysis of Nxt1-dependent gene expression in testes.
(A) Scatter plot showing normalised expression levels in control testes vs. Nxt1z2-0488/Nxt1DG05102 mutant testes of all probes on the Affymetrix expression arrays. Red dots correspond to probes for genes with introns, blue dots are probes for intron-less genes. (B) FlyAtlas expression data for 485 probes that are 16× or more down-regulated in Nxt1 testes compared to control. “Up” indicates probes whose signal is 2× or more higher in the specific tissue than whole fly, “Down” indicates 2× or more lower signal in the specific tissue than whole fly. TA ganglion = Thoracioabominal ganglion. (C) Scatter plots showing log2-transformed fold changes in Nxt1-vs-control and aly-vs.-control pairwise combination. Red indicates intron-containing genes, blue represents intron-less genes. (D) Venn diagram to show that most highly Nxt1-dependent genes (blue) have testis-specific expression (green), and that most highly Nxt1-dependent genes are also highly aly-dependent (red), but not vice versa.

