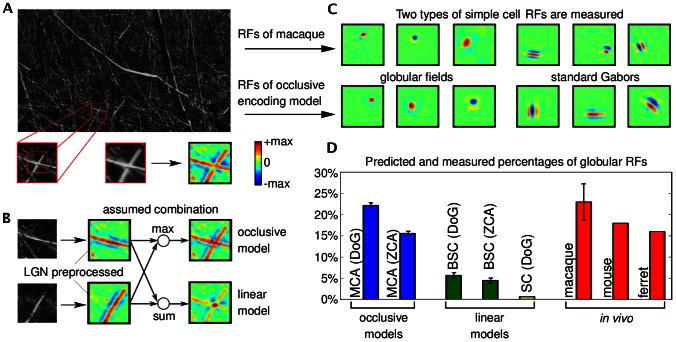
Figure 1. Illustration of the combination of image components, comparison with computational models of component combinations, and receptive field comparison.
A Image patch (bottom left) showing an intersection of two branches extracted from a grey-level natural scene image (adapted from the van Hateren natural image database [58] with permission from J. H. van Hateren). Preprocessed version of the image patch (bottom right) obtained by using a center-surround filter to model the preprocessing by the lateral geniculate nucleus. B Left: Two image patches manually generated from the grey-level patch in A. Each patch is dominated by one of the two crossing branches of the original patch. Middle: The preprocessed versions of the two patches (central parts). Right: Combination of the two preprocessed patches using an occlusive combination (top) and a standard linear combination (bottom). C Examples of globular and Gabor-like receptive fields measured in V1 of macaque monkeys (courtesy of D. Ringach), and examples of the two receptive field types predicted by the occlusive encoding model. D Percentages of globular receptive fields predicted by different models for  hidden units compared to percentages of globular fields of in vivo recordings.

