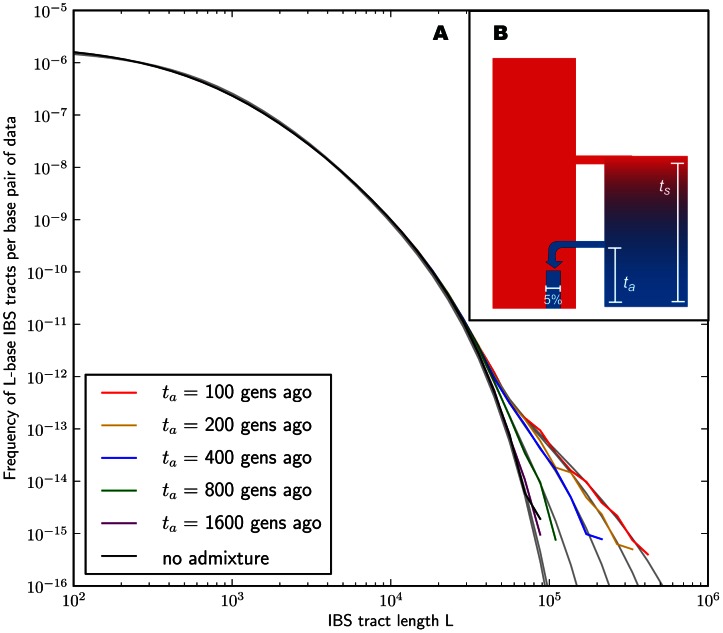
Figure 2. Spectra of IBS sharing between simulated populations that differ only in admixture time.
Each of the colored tract spectra in Figure 2A was generated from  base pairs of sequence alignment simulated with Hudson's MS [68]. The IBS tracts are shared between two populations of constant size 10,000 that diverged 2,000 generations ago, with one haplotype sampled from each population. 5% of the genetic material from one population is the product of a recent admixture pulse from the other population. Figure 2B illustrates the history being simulated. When the admixture occurred less than 1,000 generations ago, it noticeably increases the abundance of long IBS tracts. The gray lines in 2A are theoretical tract abundance predictions, and fit the simulated data extremely well. To smooth out noise in the simulated data, abundances are averaged over intervals with exponentially spaced endpoints
  .
.

