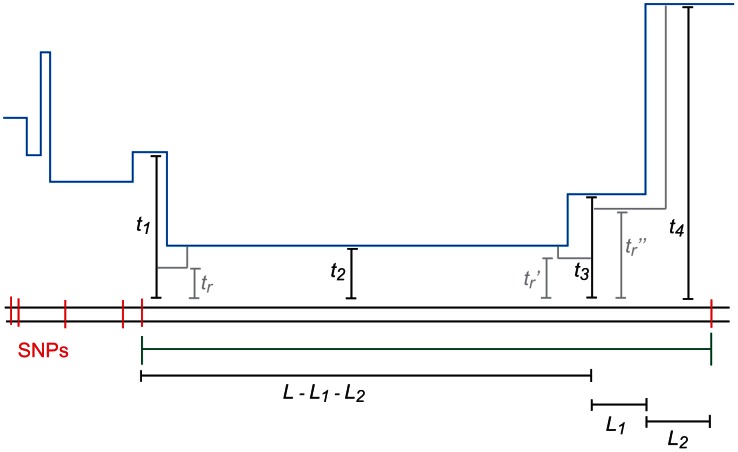
Figure 10. An  -base IBS tract with three recombination events in its history.
A blue skyline profile represents the hidden coalescence history of this idealized IBS tract. In order to predict the frequency of these tracts in a sequence alignment, we must integrate over the coalesence times  as well as the times
  ,
,  , and
, and  when recombinations occurred.

