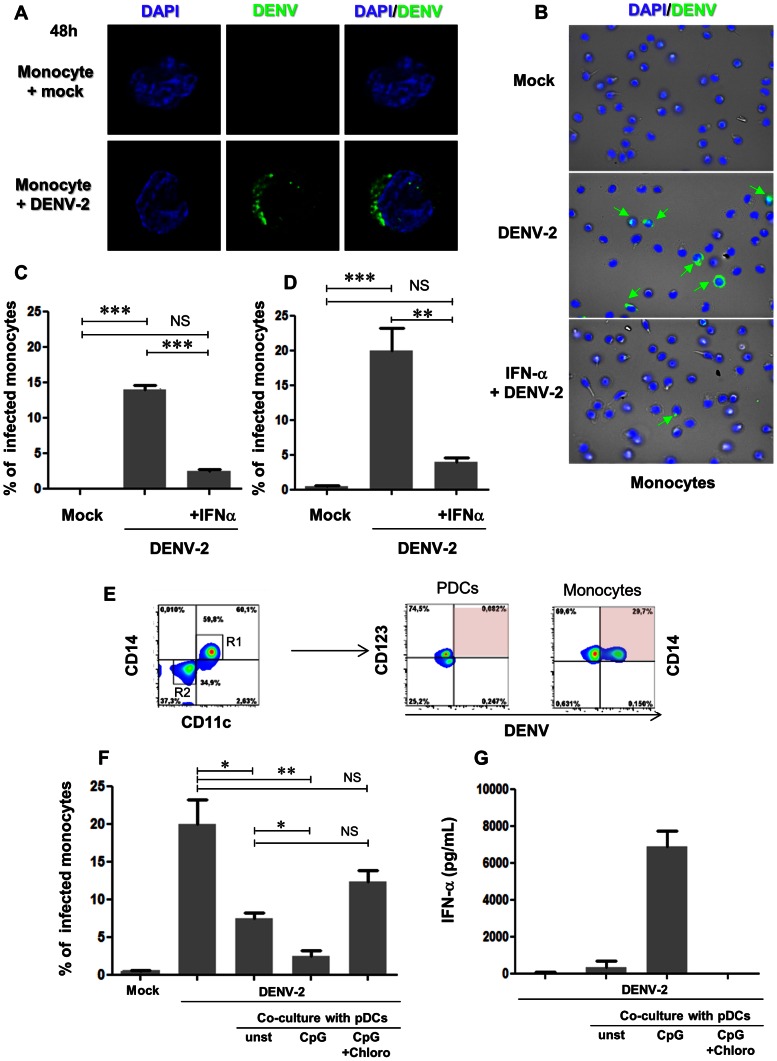
Figure 5. IFN-α treatment and activated pDC coculture in DENV-2-infected monocytes.
Freshly purified monocytes were infected with DENV-2 (MOI 10) for 48 hours, pre-treated or not with IFN-α. (A) Nucleus/DAPI (blue) and virus (green) of monocytes mock- (upper panels) or DENV-2-infected (lower panels). Viral particles were detected in the cytoplasm only in DENV-2-infected monocytes. (B) Nucleus/DAPI (blue), virus (green) and phase contrast (grey) for different stimuli (mock – top, DENV-2 only – middle, IFN-α+DENV-2 – bottom) in monocytes. Green arrows show intracellular detection of DENV particles in DENV-2 infected monocytes, whereas pre-treatment with IFN-α strongly reduced viral antigen detection. Quantification of DENV antigens in mock, DENV-2 and IFN-α pre-treated DENV-2-infected monocytes using microscopy (C) or flow cytometry (D). (E) Freshly purified monocytes were DENV-2-infected then immediately cocultured with DENV-2-stimulated pDCs. DENV antigen detection in CD14-CD11c-CD123+ pDCs or CD14+CD11c+ monocytes after 48 h of culture. Monocytes were DENV-2-infected then immediately cocultured with CpG-stimulated only (CpG), Chroloquine pre-treated CpG-stimulated (CpG+Chloro) or unstimulated (unst) pDCs (figure S2). Cocultures were analysed 48 h later for viral antigens (F) and IFN-α production (G). Data represent independent experiments from two different donors and values were submitted to paired t test in which * p<0.05; ** p<0.005 and *** p<0.0005.

