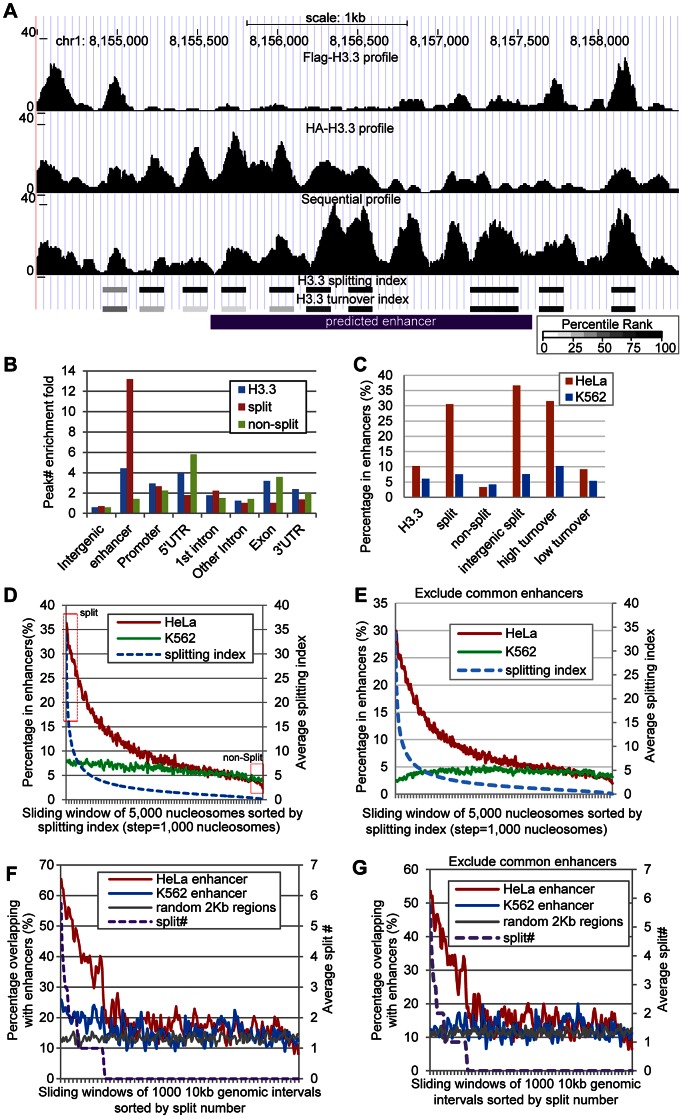
Figure 6. H3.3 nucleosome splitting events feature cell-type specific enhancers.
(A) An example enhancer region enriched with split H3.3 nucleosomes. Profiles of single-round ChIPs, sequential ChIP, turnover index, splitting index are illustrated. Percentile ranking of turnover index and splitting index are shown in a grey scale. (B) Split H3.3 nucleosomes were specifically enriched at enhancers, whereas the non-split H3.3 nucleosomes were specifically depleted at enhancers. (C) Distribution of the H3.3 nucleosomes, split and non-split H3.3 nucleosomes, intergenic split H3.3 nucleosomes and high and low turnover H3.3 nucleosomes at the cell-type specific enhancers. (D) All H3.3 nucleosomes were sorted by their splitting index and grouped into 5000 nucleosome widows. These nucleosomes were then plotted against their overlap percentage with enhancers. The arbitrarily defined split and non-split nucleosomes with top or bottom 5% splitting index were boxed in red. (E) Similar to (D), but common enhancers were excluded. (F) The 10-kb genomic intervals sorted by their numbers of split nucleosomes were plotted against their overlap percentage with the cell-type specific enhancers. (G) Similar to (F), but common enhancers were excluded.

