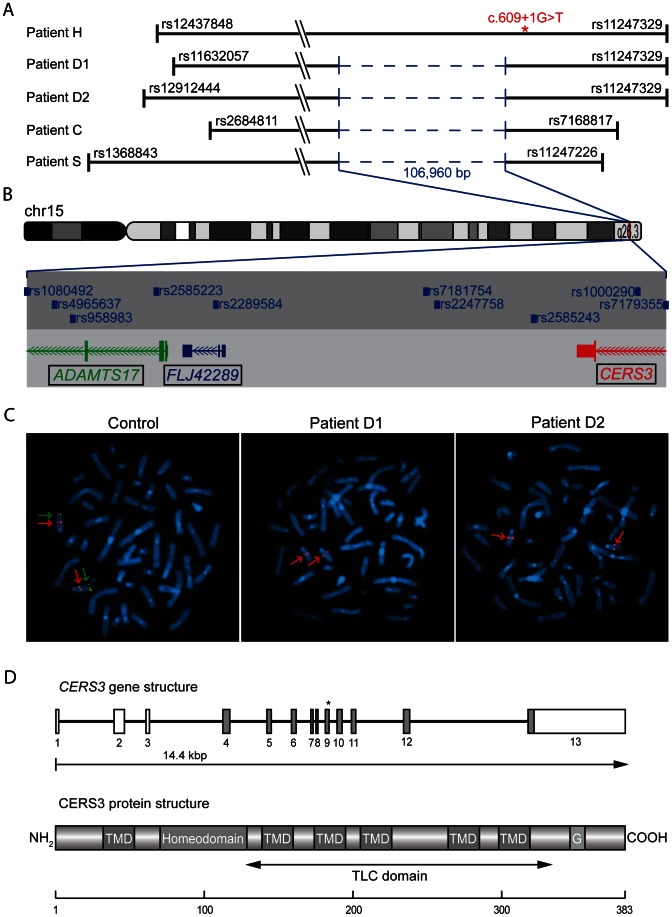
Figure 2. Deletion and CERS3 mutation scheme.
(A) Homozygous regions on chromosome 15q26.3 in patients. The smallest common interval is defined by rs2684811 in patient C and rs11247226 in patient S. The genomic deletion characterized by breakpoint spanning PCR (in blue) encompasses 106,960 bp with the borders 100,856,031 to 100,962,985 on chromosome 15 (UCSC hg19, February 2009) in patient D1, D2, C, and S. The splice site mutation in patient H is marked by an asterisk. The diagram shows the deletion and the limiting SNPs of the homozygous regions in patient H, D1, D2, C, and S (not to scale). (B) The scale illustration of the deleted region shows the missing SNPs and genes. The internal limit of the deletion is between SNP rs1080429 and rs7179355. (C) FISH signal pattern in a healthy individual shows the control signal on 15q21.2 in red (digoxigenin-labeled BAC RP11-562A8) and the signal corresponding to 15q26.3 in green (arrow). In patients D1 and D2 the green FISH signal is missing confirming the microdeletion in 15q26.3. (D) Diagram depicting the structure of the human CERS3 gene and the site of mutation in exon 9 (c.609+1G>T) of patient H indicated by an asterisk. Below is illustrated the predicted structure of human CERS3 protein including transmembrane domains (TMD), homeobox, polyglutamic acid region (G), and the TLC (TRAM, LAG1 and CLN8 homology) domain.

