
Figure 3. Histological analysis and CERS3 protein expression in skin biopsies and cultured keratinocytes from healthy controls and patient H.
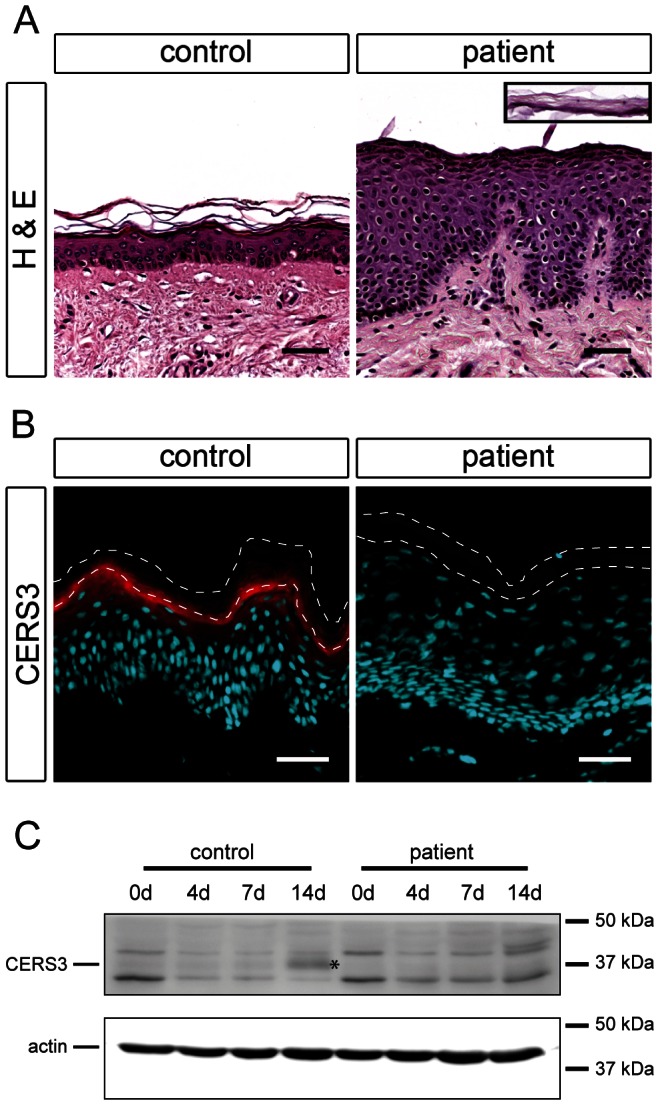
(A) Hematoxylin and eosin staining (H&E) shows acanthosis with a thickening of the granular layer and psoriasiform epidermal hyperplasia in the patient compared to a healthy control. The inset (same scale) shows the detached stratum corneum of the patient. Scale bars, 50 µm (B) Immunofluorescence staining using a specific antibody for CERS3 (red) and DAPI (blue) as nuclear counterstaining. CERS3 staining is present at the interface between the stratum granulosum and the stratum corneum in control skin but not detectable in the patient skin. The thin dashed lines indicate the interface between the stratum granulosum and the stratum corneum as well as the upper edge of the stratum corneum. Scale bars, 50 µm (C) Western blot analysis of CERS3 in control and patient keratinocytes before differentiation (0 d) and at day 4, 7, and 14 after induction of differentiation. CERS3 was detected at ∼37 kDa (indicated by an asterisk) using an antibody targeting the C-terminus of the protein. An antibody that recognizes actin was used as a loading control.