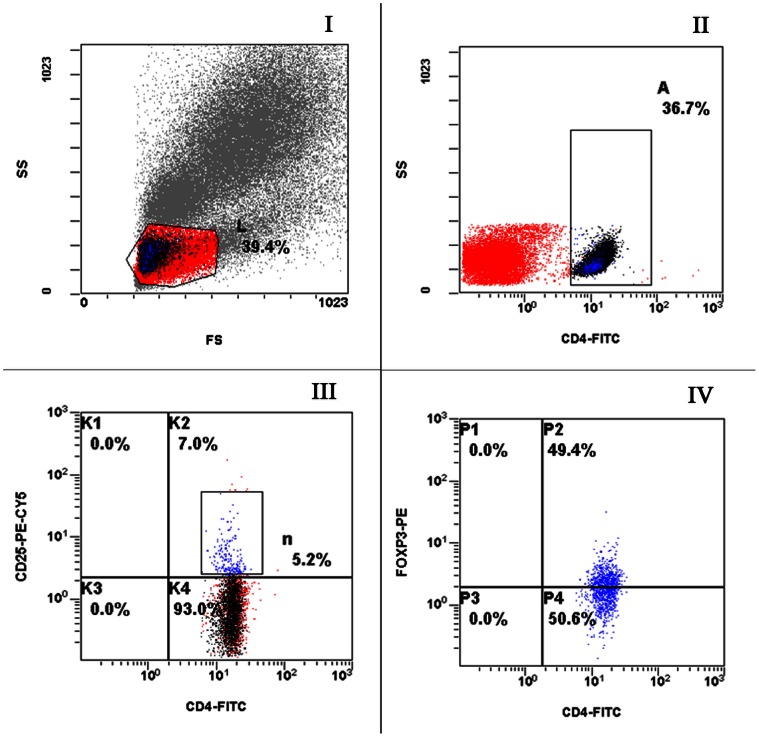
Figure 3. Representative flow plots from a healthy control labeled with anti-CD4, CD25 and Foxp3.
Appropriate isotype controls were included to establish the positive gates. (I) FSC and SSC to identify lymphocytes. (II) CD4+ cells within the lymphocyte gate. (III) Cells were gated on the CD4+ cells shown in B and CD4+CD25+ cells were determined. (IV) Cells were gated on CD4+CD25+ cells and Foxp3 expression was determined.

