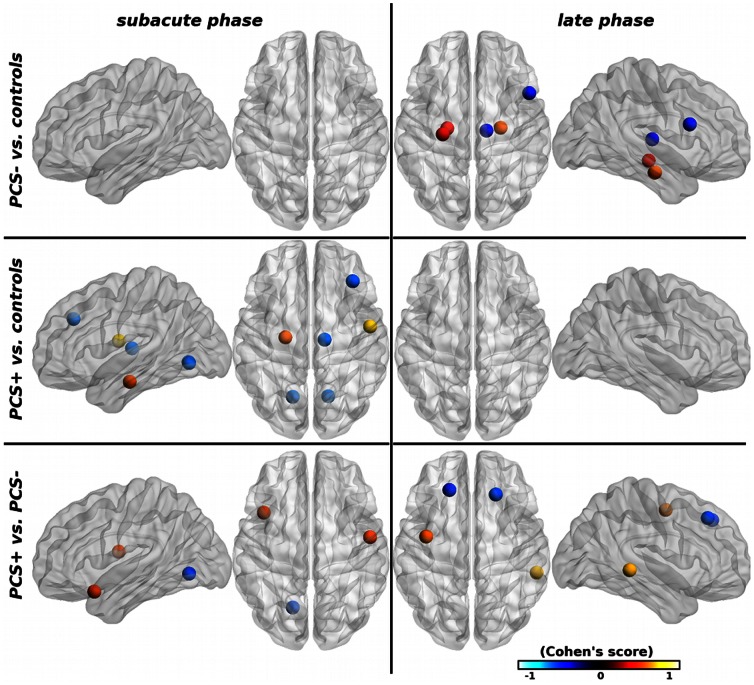
Figure 2. Statistical connectograms of differences between mTBI patients and controls, showing significant effect in regional characteristics at the subacute and late phases after the injury at p<0.05 (uncorrected).
The outermost ring shows brain regions arranged by lobe and subcortical structures and further ordered anterior-to-posterior (color map is lobe-specific). Bottom right: legend of the representation of regional metrics in the connectogram. Within the circular structure representing the brain parcellation, two sets of seven circular heat maps (or rings) are shown. Each set encodes for the subacute and late phases after the injury respectively, while each heat map encodes for regional graph theory properties (basic and topological) associated with the corresponding parcellation. Proceeding inward towards the center of the circle, these measures are: nodal centrality and efficiency, local efficiency, degree, edge diversity and strength. Red (resp. blue) color represents positive (resp. negative) effect.

