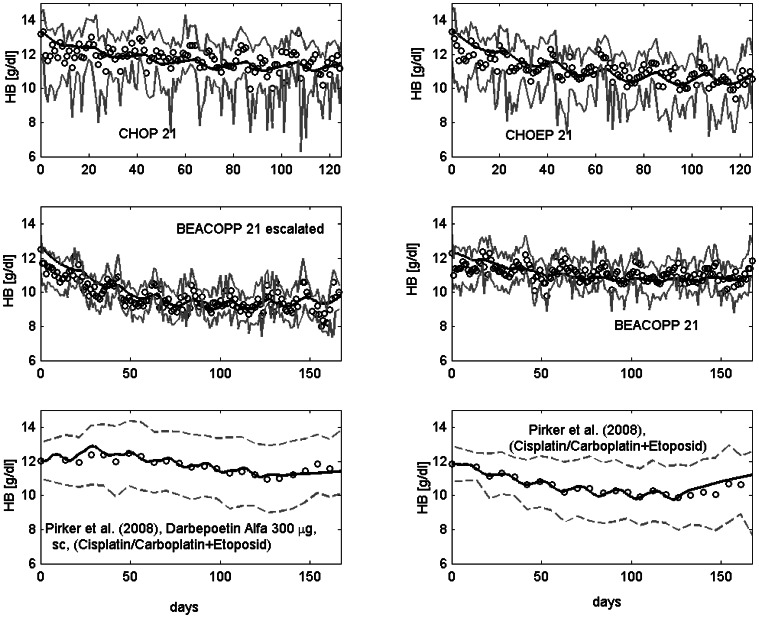
Figure 8. Comparison of model and data for a number of chemotherapy scenarios.
Dots represent patient medians (first four) or means (last two), grey solid lines the interquartile range of data, grey dotted lines mean  standard deviation. Black solid line is the model prediction.The following chemotherapies are displayed: CHOP, CHOEP, BEACOPP 21 escalated, BEACOPP 21, for which we have access to raw data (studies are described in [15], [16], [19], [20]), and Platinum plus Etoposide with or without Darbepoetin Alfa (data were extracted from the literature [59]).

