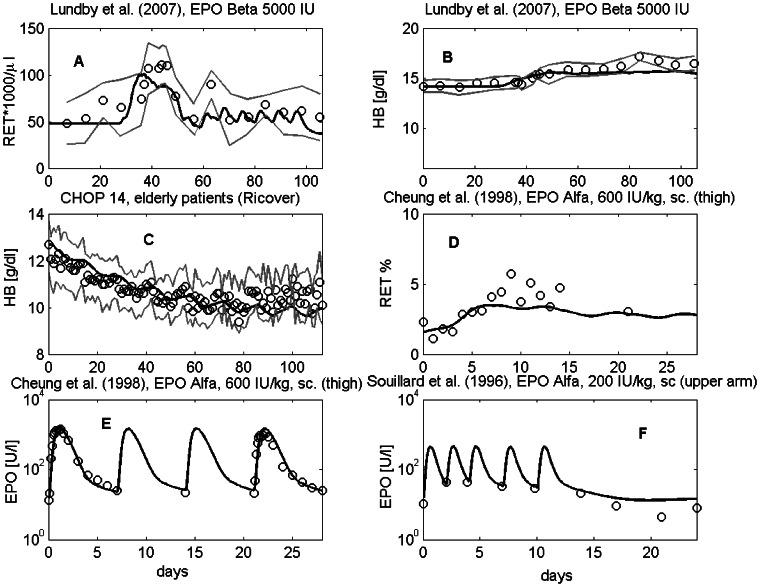
Figure 10. Validation scenarios.
Reticulocytes (A) and HB (B) after multiple injections of EPO Beta (data were extracted from [32]): dots represent patient means, grey dotted lines mean  standard deviation. (C) HB under eight cycles of CHOP-14 therapy (we have access to the raw data, the study is described in [18]): dots represent patient medians, grey lines represent interquartile range of patient data. Reticulocytes (%) (D) and EPO serum concentrations (E,F) after multiple EPO Alfa injections at different subcutaneous sites [31], [33]: dots represent patient means. Solid black curve represents model predictions throughout.

