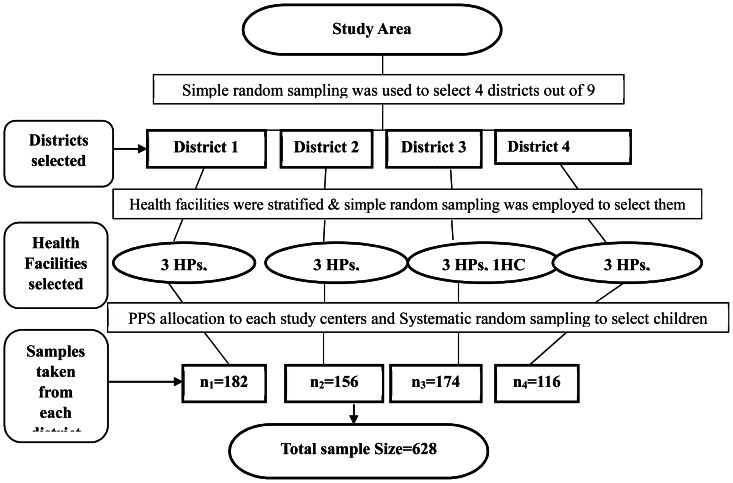
Figure 1. Sampling procedures.
The phenomena regarding the child nutrition were assumed to be homogenous among the districts of the study zone. Thus, four districts out of nine were selected using simple random sampling. The health facilities rendering OTP were stratified into health centers and health posts. One health center and three satellite health posts were included from each district. Using the Probability Proportional to Size (PPS), the n1, n2, n3, and n4 samples were drawn. Finally, the OTP record card of each child was selected using systematic random sampling. HP: health post; HC: health center.

