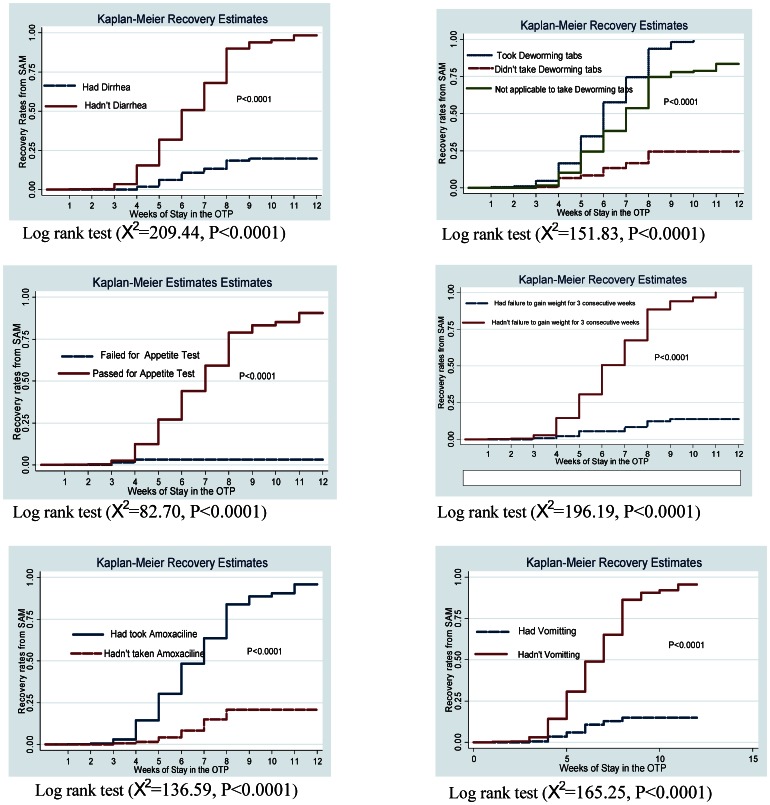
Figure 2. Kaplan Meier survival curves and Log-rank test for recovery rates over grouped factors.
The KM survival curves for each grouped factor were identified by color and pattern differences. They showed the recovery rates over the OTP intervention. The KM curves enable to compare the recovery rates between those with and without diarrhea, vomiting, loss of appetite with Plumpy'Nut, failure to gain weight and over children who took de-worming and amoxicillin drugs as compared to those who didn't take the drugs. The log-rank tests the significance of the observed differences in recovery rates on the KM survival curves between the grouped factors. X2: Chi-squared test.

