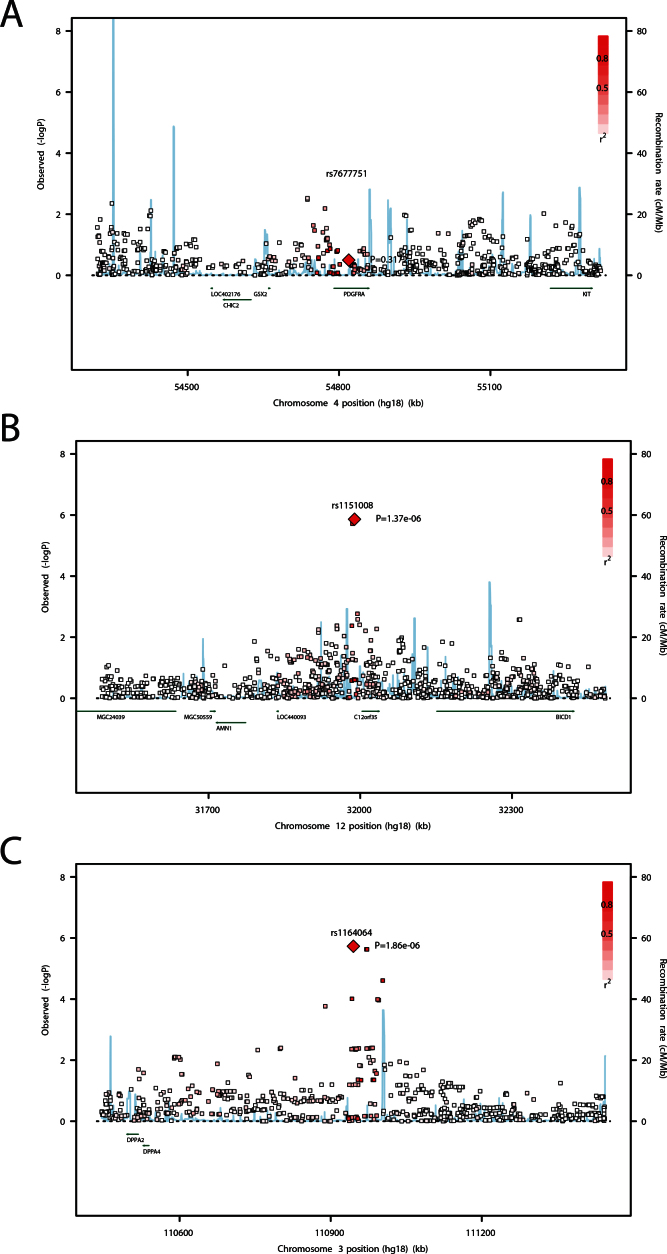
Figure 3.
Locus-specific plots of the most significant single nucleotide polymorphisms (SNPs) in this study. These plots display the most significant result in the meta-analysis genome-wide association study (GWAS). The locus identified by Fan et al. Chromosome 4q12 (A) and two loci identified in this study Chromosome 12p11 (B) and 3q13 (C) are shown. SNPs are plotted as the –log10 of the p value.

