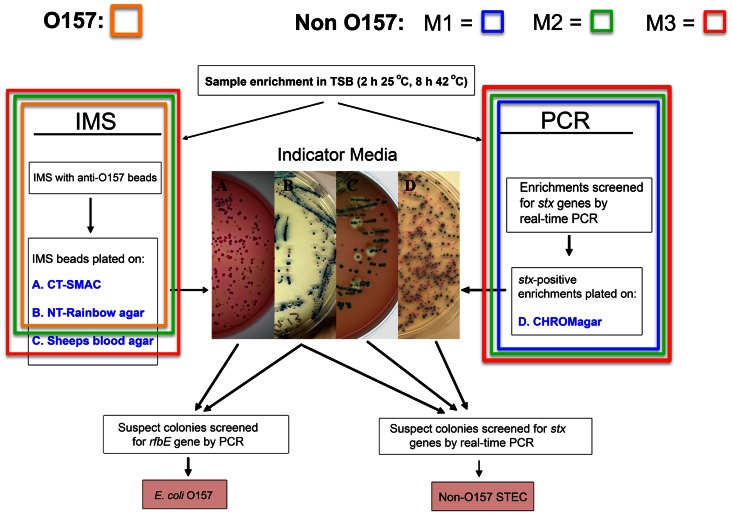
Figure 1. Flow chart for STEC isolation (O157 and non-O157) and examples of typical colony morphologies.
The final isolation protocol (M3) incorporates the M1 and M2 methods and starts with enrichment in TSB and plating anti-O157 magnetic beads on three different media (“IMS”; media A, B, C) and direct plating of stx-positive enrichment broths on C-O157 (“PCR”; medium D). O157 suspect colonies appear as pale and steel blue colonies on SMAC and NT-RA, respectively. Suspect STEC colonies from any media are subcultured on LB and confirmed as either O157 or non-O157 STEC by PCR. Anti-O157 magnetic beads bind other bacteria present in enrichment broths of environmental samples, but, fortuitously, also many non-O157 STEC. Typical non-O157 STEC colonies are shown from enrichments growing on C-O157 (Indicator Media, panel D, blue colonies), NT-RA agar (panel B, pink colonies). Non-O157 STEC colonies expressing beta-galactosidase and hemolysin are indicated by blue colonies with a clearing zone of hemolysis on mSBA (panel C). The parts of the final method for isolating O157 and non-O157 STEC are shown by an orange box (O157), blue box (M1), green box (M2) and red box (M3).

