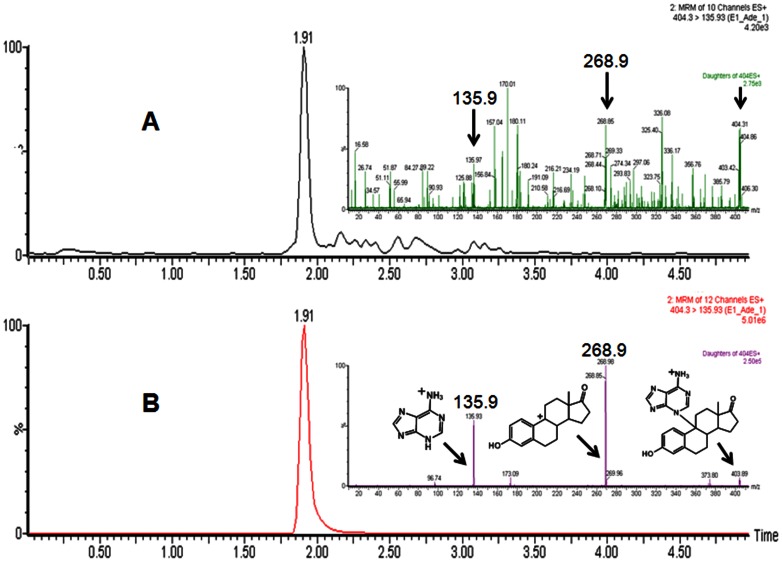
Figure 4. UPLC–MS/MS chromatogram of assay mixture (A) and standard E1-9-N-Ade (B).
E1-9-N-Ade was formed by peroxidase-catalyzed oxidation of E1 through methide. Insets: MS/MS spectra of E1-9-N-Ade from assay mixture (A) and standard E1-9-N-Ade (B). A plausible fragmentation of parent ion (404, M+1 ion) leading to major peaks is presented. Arrows indicate peaks that are common to assay mixture and standard.

