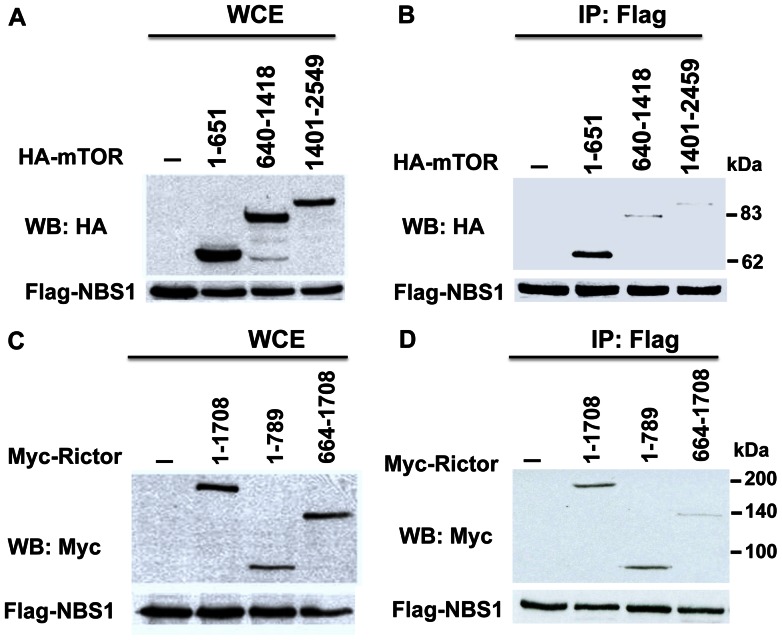
Figure 2. Mapping of the domain in mTOR or Rictor interacting with NBS1.
A & B. Co-immunoprecipitation assays showed the interaction between the N-terminal domain of mTOR and NBS1. Whole cell extracts were shown in A. C & D. Co-immunoprecipitation assays showed the interaction between the N-terminal domain of Rictor and NBS1. Whole cell extracts were shown in C.

