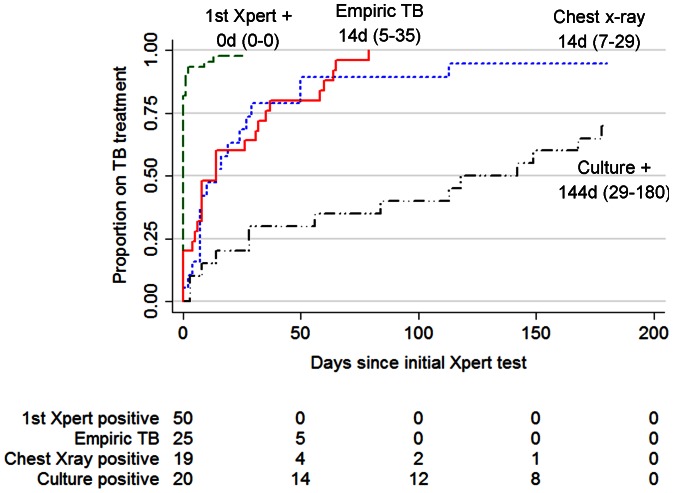
Figure 2. Time to TB treatment in 114 TB cases, by basis of TB treatment initiation.
Kaplan-Meier curves showing time to treatment stratified by basis of TB diagnosis, excluding those diagnosed based on 2nd Xpert or sputum smear microscopy (n = 2). The median time to treatment and IQR for each basis of TB treatment initiation are listed. Abbreviation: TB, tuberculosis.

