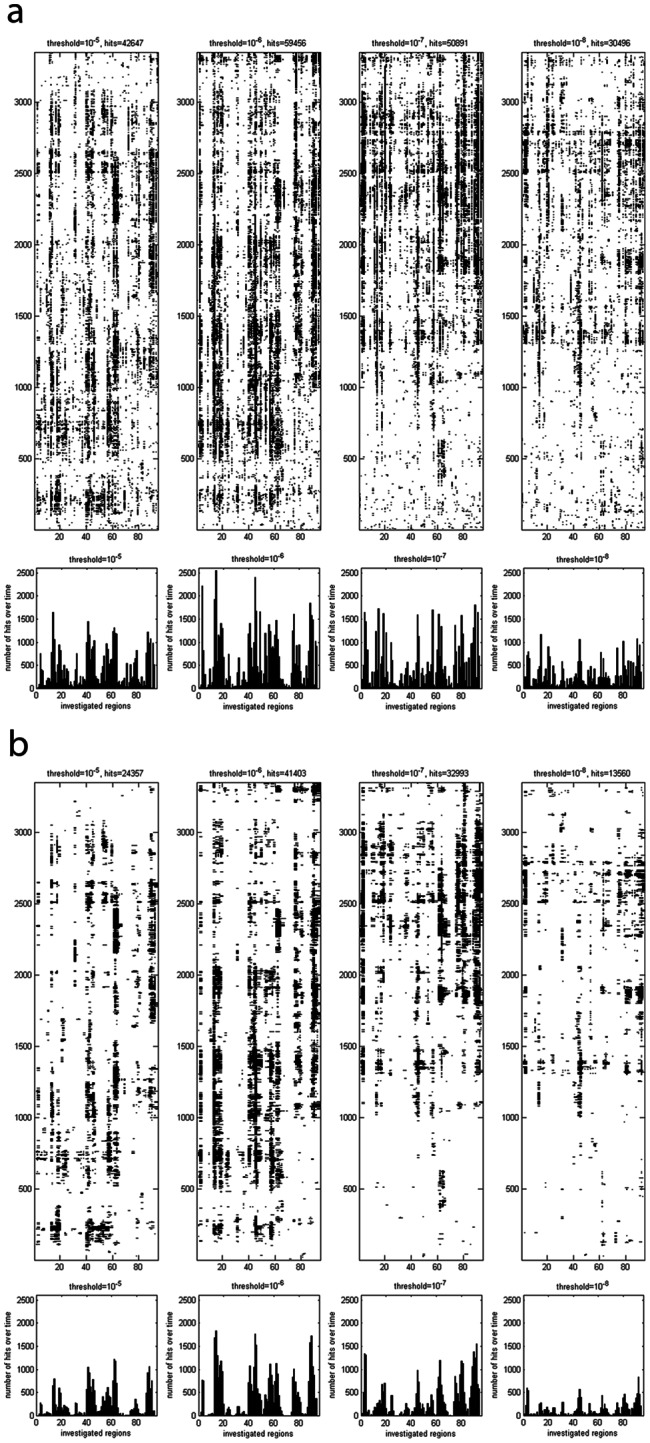
Figure 3. Effect of the median-method.

(A) The identical data as in Figure 2A is illustrated. Again a black dot at time step x and region y indicates that a t-test{[(all “groupM” RMSD values), (all “groupL” RMSD values)] | x, y, α} yielded a difference. This approach is termed the direct-method. (B) The identical data as in Figure 2A is illustrated, however, processed with the median-method.
