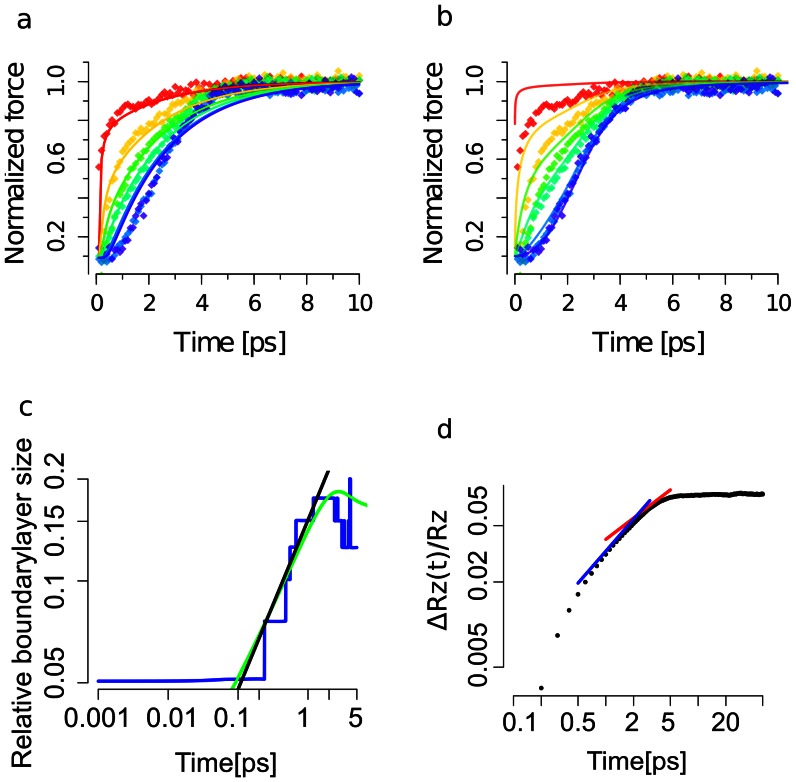
Figure 2. Tension propagation from MD simulations and comparison to dynamic bead-spring and semiflexible chain models.
(a) Tension evolution as predicted by a bead-spring model (colored curves) fitted to the tension in Ala as obtained from MD simulations (colored diamonds). Coloring red, yellow, green yellow, blue and purple show residue pairs 1–2, 4–5, 7–8, 10–11, 15–16 and 20–21, respectively. A manually reduced friction coefficient was used to map the WLC model and numerical results. We note that here forces were averaged over 100 fs time periods for clarity. (b) Tension evolution from the dynamic WLC model (colored curve) fitted to the tension in Ala
 as obtained from MD simulations (colored diamonds). Coloring and averaging as in (a). (c) Boundary layer size
  relative to the contour length
  obtained from MD simulations shown in blue. Numeric solution to the dynamic WLC model prediction in green and
  growth law in black. (d) Extension
  shown as black dots compared to two growth laws,
  in blue and
  in red.

