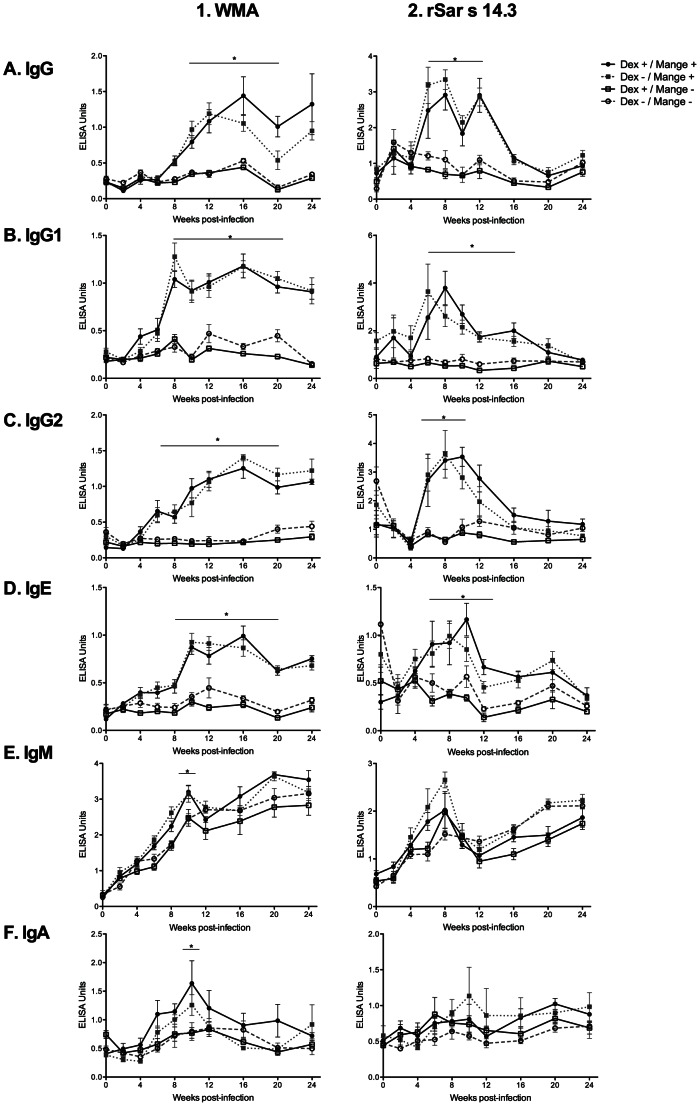
Figure 3. Isotype specific WMA (1) and Sar s 14.3 (2) antibody responses over 24 weeks for the four pig treatment groups.
Error bars represent mean ±SEM. *: p<0.05, compared to group D (Dex −/Mange -) (two way repeated measures ANOVA). The first two weeks were not tested by ANOVA due to the requirement for matched numbers, and insufficient sera samples from some pigs.

