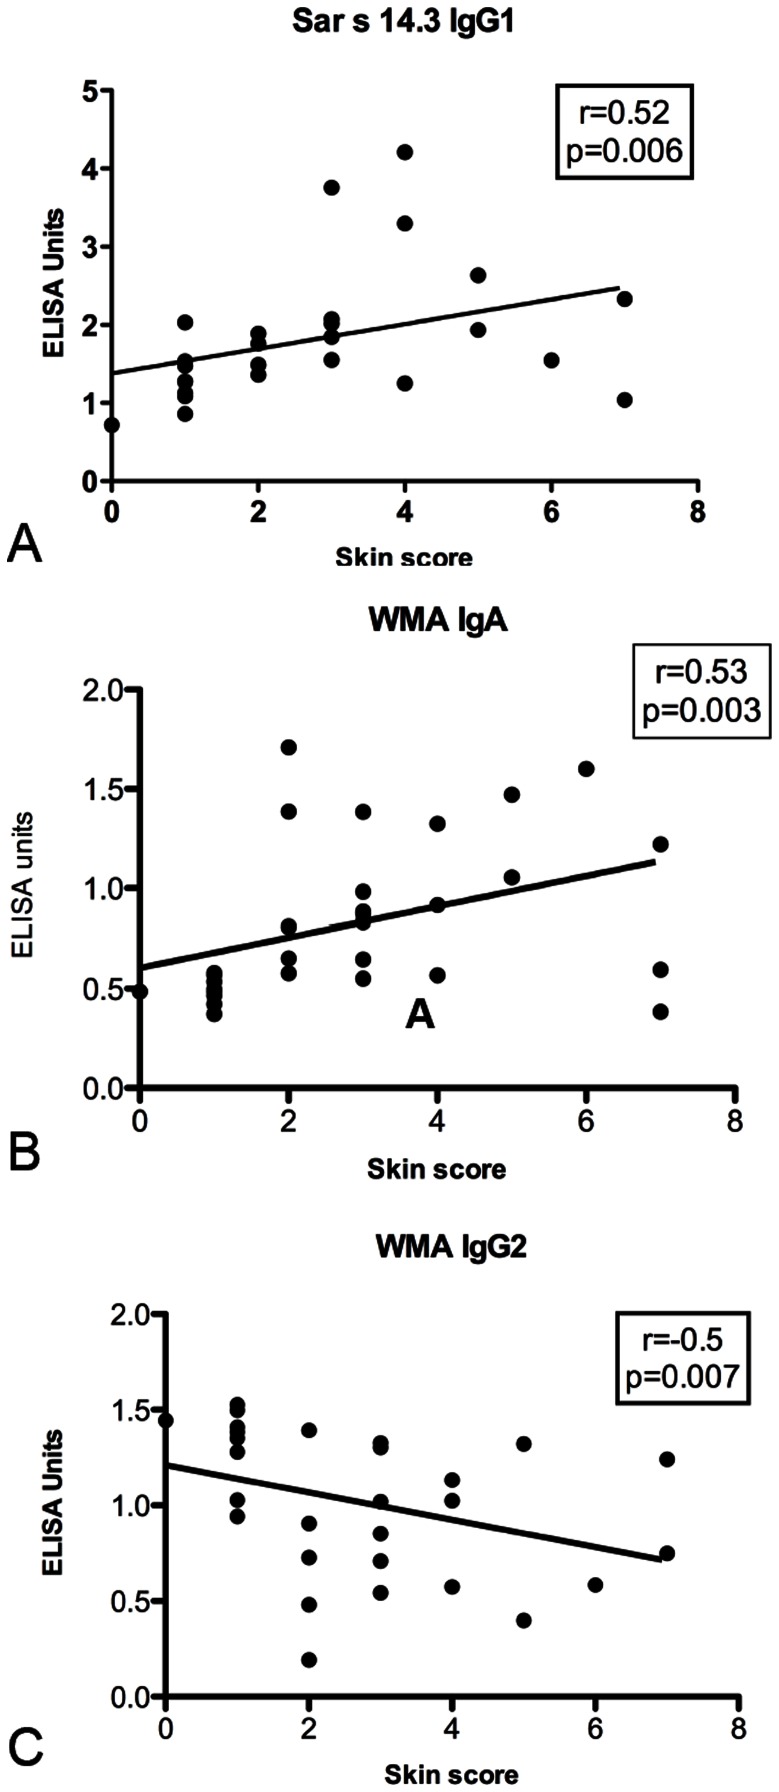
Figure 4. Correlation between lesion severity and antibody response.
Scatter plot showing lesion score and ELISA units from mange infected pigs in the non-Dex treatment group from weeks 8–20 post infection. Each point represents the lesion score and antibody level for an individual pig at a single time point. R: Spearmans correlation coefficient.

