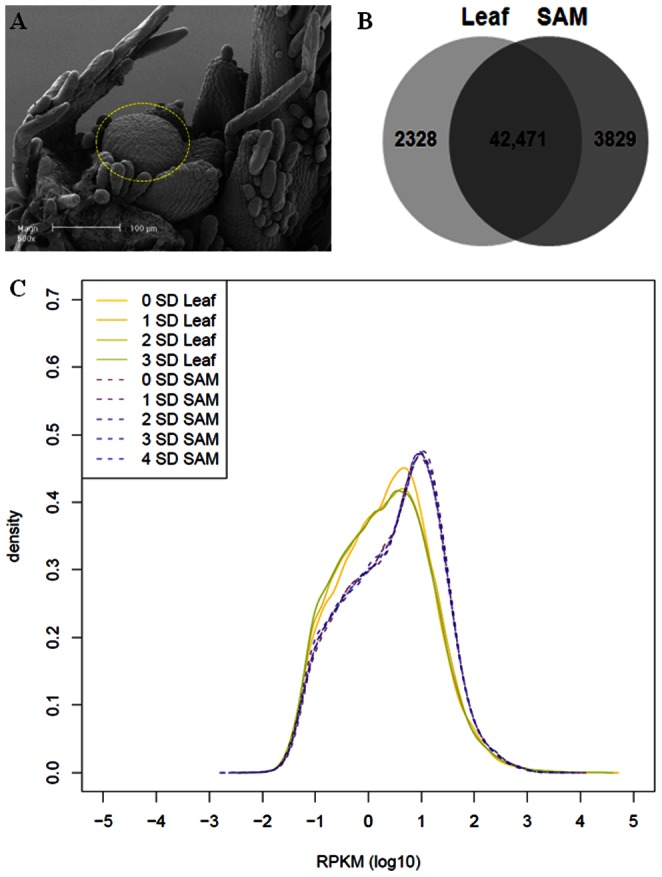
Figure 1. Expression of annotated transcripts.

A. Soybean shoot apical meristem from 10 days old plant as viewed by SEM. Shoot apical meristem sample dissected is in dotted line. B. A Venn diagram showing the overlap of identified transcripts based on Glyma1 annotation for the leaf and SAM library. C. The expression level of transcripts in reads per kb per million (RPKM) for each library. SD, short-day.
