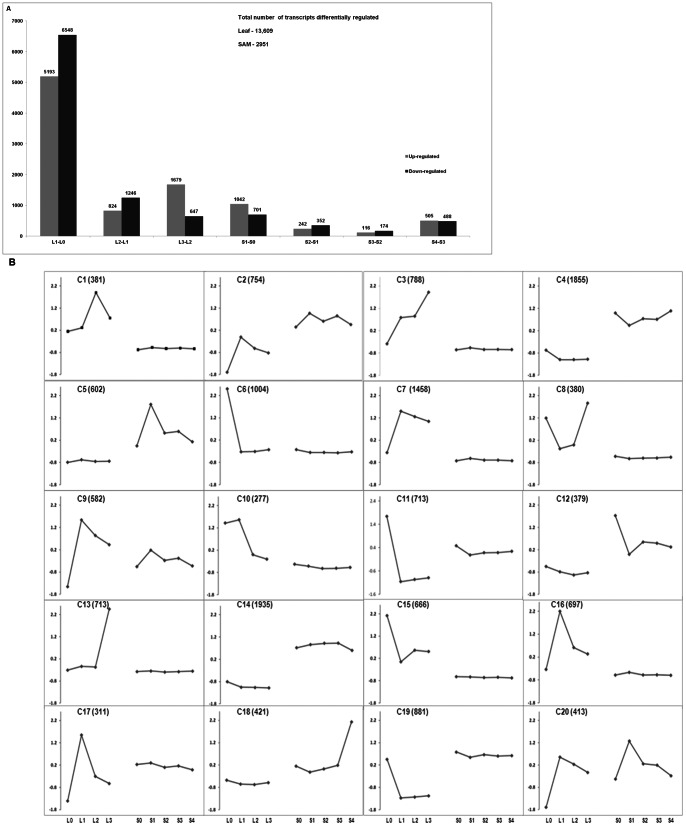
Figure 2. Differential expression of genes during short-day treatment.
A. Number of genes significantly up-or down-regulated during the short-day treatment relative to the previous time point is indicated. B. K-means clustering illustrating the expression (Z-score normalized) profile of the soybean leaf and SAM transcriptome. Twenty clusters were used for a total of 15, 210 transcripts with significant expression profile changes in either leaf or SAM. Total number of transcripts in each cluster is indicated in parentheses. L0–L3: samples derived from leaf after 0-short-day (L0), 1-short-day (L1), 2-short-day (L2) or 3-short-day (L3) treatment. S0–S4: samples derived from SAM after 0-short-day (S0), 1-short-day (S1), 2-short-day (S2), 3-short-day (S3) or 4-short-day (S4) treatment.

