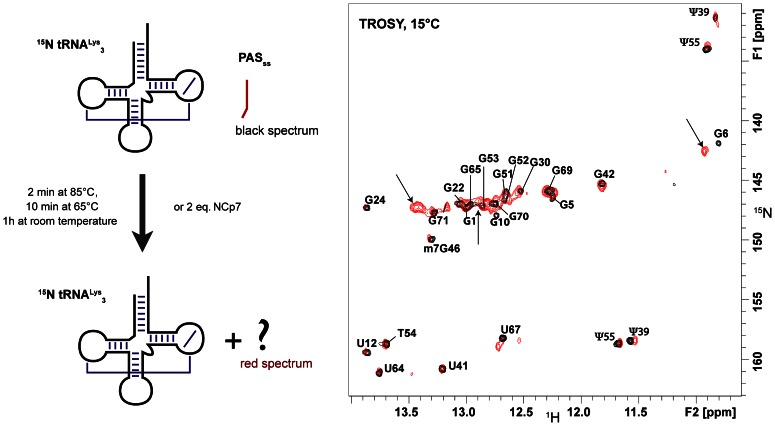
Figure 3. Tests of annealing of PASss to tRNALys 3.
A) Schematic drawing of the experimental procedure, B) Superimposition of two TROSY experiments recorded at 15°C showing the imino groups of tRNALys 3 (0.1 mM) alone (in black, reference spectrum) and after the heat-annealed procedure with 1 equivalent of PASss (red spectrum). The arrows indicate peaks corresponding to the PAS/anti-PAS complex described in Figure 7.

