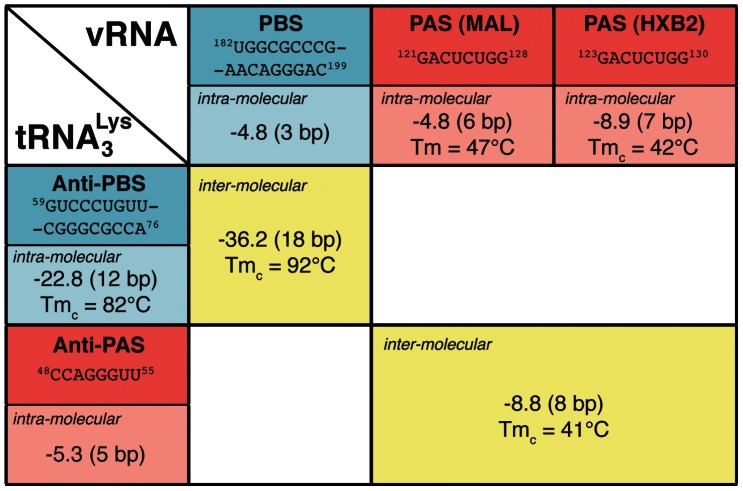
Figure 5. Thermodynamic stability of the interaction involving the PBS (in blue) or the PAS (in red) sequences.
ΔG values calculated with UNAFold [57] are indicated in kcal/mol and the number of base pairs are indicated in parenthesis. The melting temperature Tmc was calculated by UNAFold and the melting temperature Tm was measured by UV spectroscopy (Figure S5). See also Figure S1 for details on the different sequence and secondary structures used to model the intra-molecular interaction within the MAL and HXB2 isolates.

