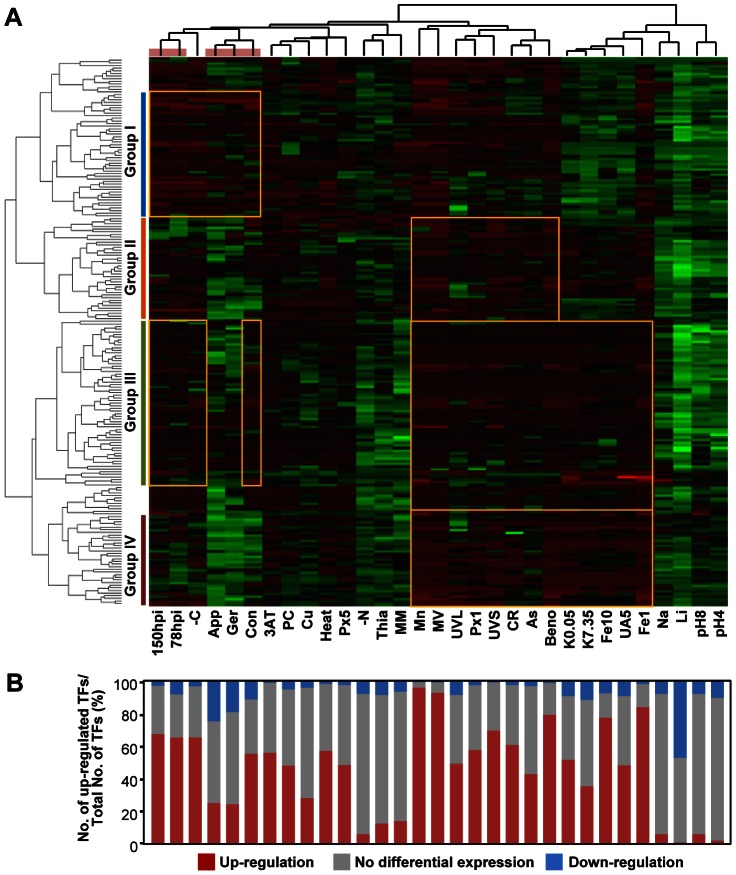
Figure 2. Expression profiles of TF genes.
(A) Heat map showing expression patterns of 206 TF genes under 31 different conditions. The color for each gene indicates its expression level relative to its mean across all of the experiments. Red indicates up-regulation; black, no differential expression; green, down-regulation. Top, condition tree; left, gene tree. The pink bar at the top indicates five infection-related conditions. The yellow rectangles indicate distinct expression patterns in each group. (B) Percentages of up-regulated, not differentially expressed, and down-regulated TF genes under each condition.

