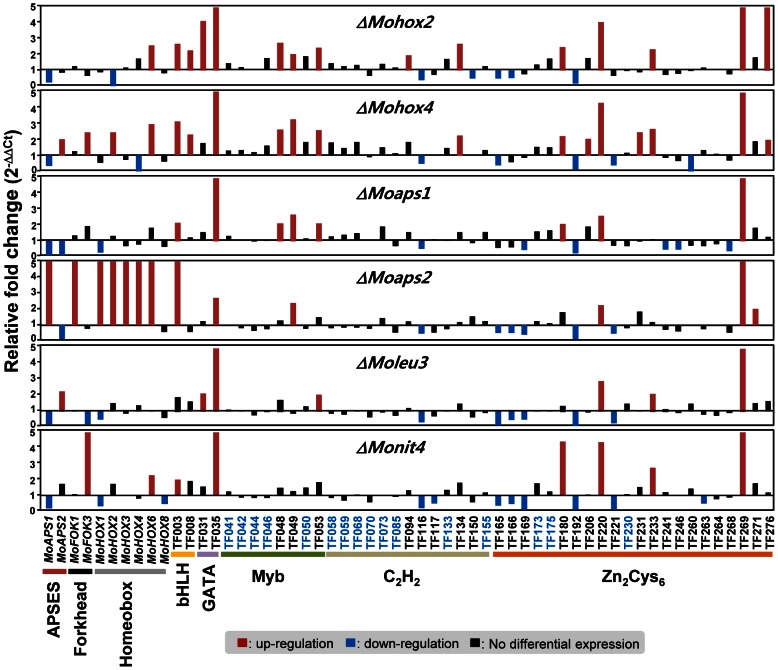
Figure 6. Expression profiles of 57 conidiation-specific TF genes in six TF gene deletion mutants.
The mutants included ΔMoaps1, ΔMoaps2, ΔMohox2, ΔMohox4, ΔMoleu3, and ΔMonit4. Up-regulated genes in the mutants (more than 2 fold) are indicated by red bars, and down-regulated genes (less than 0.5 fold) are noted by blue bars. The genes that did not show differential expression in the six mutants are marked in blue.

