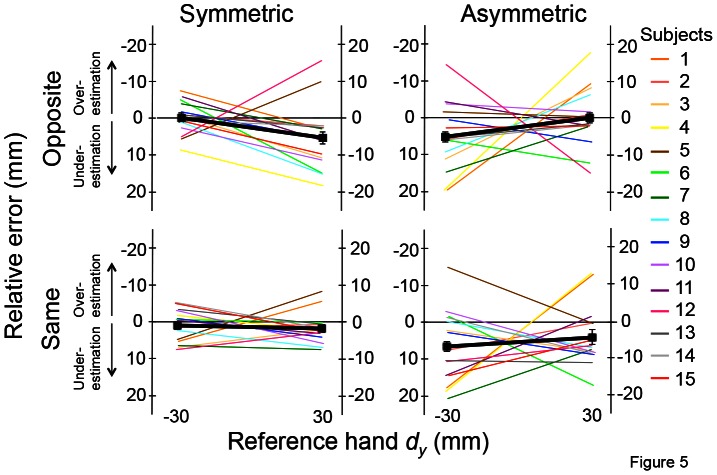
Figure 5. Relative error: individual subjects.
Averages of relative errors of 5 trials from each subject are shown as a function of reference hand dy (−30 and +30 mm) for each of the four matching conditions. The thick black line denotes the mean relative error averaged across 15 subjects with standard error of the mean. Data from the collinear condition were excluded (see text for more details). The left- and right-hand y-axes for each plot refer to relative errors obtained for reference hand dy of −30 and 30 mm, respectively, in which positive or negative relative error are defined as under-estimation errors, respectively.

