
Figure 6. Relative error: averaged data.
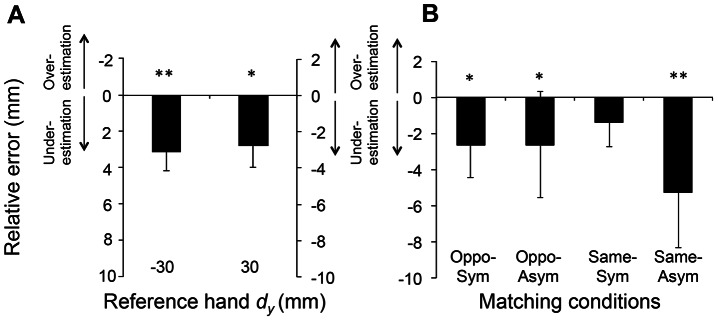
Relative errors were compared across reference hand dys and matching conditions (panels A and B, respectively). For Panel A, the relative errors with respect to the under- and over-estimation are shown in the same format as Figure 5. For Panel B, relative error values were pooled across non-collinear dy. For both panels, data are averages of all subjects within a given group (±SE). Note that relative error from the collinear condition was excluded from statistical analysis across matching conditions (see text for more details). Single and double asterisks denote a statistically significant difference from zero (p<0.05 and 0.01, respectively). Note that, since the opposite signs of relative error were defined as under- and over-estimation, the sign of relative error when reference hand thumb was placed lower (dy = −30 mm) is inverted for the relative error pooled across the four conditions (Panel B) for graphical purpose only such that the negative relative error always denotes underestimation.