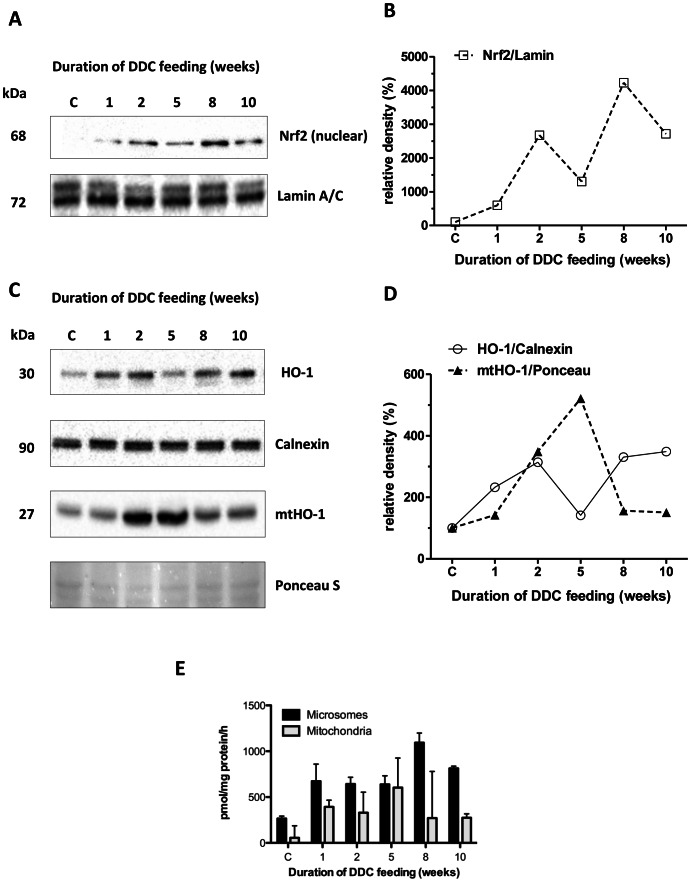
Figure 5. Expression of Nrf2 and heme oxygenase 1 in livers of DDC-treated mice.
A: Nrf2 protein expression and (B) densitometry in hepatic nuclear fractions. The intensity of protein bands was quantified, and individual blot densities were normalized to loading control (Lamin A/C) C: Heme oxygenase-1 (HO-1) protein expression and (D) densitometry in total liver homogenate (HO-1) and mitochondrial fractions (mtHO-1). The intensity of protein bands was quantified, and individual blot densities were normalized to loading control (calnexin for total homogenate, Ponceau S for the mitochondrial fraction). (E) Activities of HO-1 in microsomes and mtHO-1 in mitochondria as pmol bilirubin/mg protein/h.

