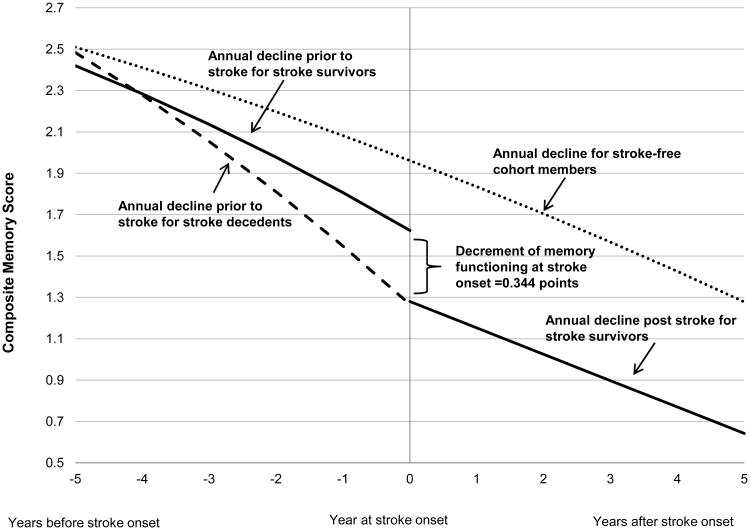
Figure 3.
Trajectory of memory score for stroke survivors (n=1189) vs. stroke decedents (n=385) vs. stroke-free cohort members (n=15766) during entire follow-up. Solid curve represents memory score change among stroke survivors, dashed curve represents memory score change among stroke decedents and dotted curve represents memory score change among stroke free cohort members. Time 0 indicates time of stroke onset for participants who experienced first incident stroke at75 years of age (stroke survivors and stroke decedents) while it represents age 75 for stroke-free cohort members. Decline at stroke onset indicates the immediate decrement of memory score at stroke onset among stroke survivors. The curves to the left of stroke onset indicate change in memory score before stroke onset while the curve to the right indicates change after stroke onset.

