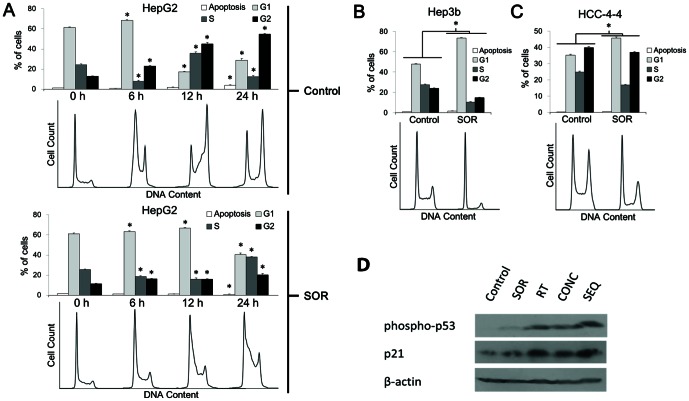
Figure 3. Mechanism of sorafenib-mediated radioprotection in vitro.
HepG2 cells were synchronized then re-fed with complete medium (10% serum) either containing 5 µM sorafenib (SOR) or vehicle control (DMSO). (A) Percent of cells in G1, S, and G2 phases with SEM is plotted for control and SOR arms, with corresponding histograms generated from flow cytometry data analysis shown below. Treatment with SOR caused a G1-S delay and cell cycle slowing in synchronized HepG2 cells, causing more cells to be in G1-S versus G2-M when radiation would be delivered 24 h after beginning incubation with SOR. (B & C) Unsynchronized Hep3b and HCC-4-4 cells were exposed to SOR or vehicle control for 24 h and then fixed with ethanol for cell cycle analysis. Percent of cells in G1, S, and G2 phases with SEM is plotted for control and SOR arms, with corresponding histograms generated from flow cytometry data analysis shown below. Treatment with SOR caused a G1-S delay in both cell lines and reduced the number of cells in G2-M when radiation would be delivered at 24 h after beginning incubation with SOR. Asterisks denote significant differences between corresponding columns in the control and SOR arms for each cell line by Student's t-test. Data for the HuH7 cell line is not shown because it was found to exhibit polyploidy; these data are displayed in Figure S2. Data for unsynchronized HepG2 cells are also shown in Figure S2. All experiments were done in triplicate and repeated. (D) Immunoblotting for phospho-p53 and p21 after treatment of HepG2 cells with each of the 5 different treatment arms (control—incubation with DMSO for 12 hours; SOR—incubation with 5-µM sorafenib for 12 hours; RT—incubation with DMSO for 12 hours with irradiation at 6-hour midpoint; CONC—incubation with 5-µM sorafenib for 12 hours with irradiation at 6-hour midpoint; SEQ—incubation with DMSO for 6 hours, irradiation, followed by incubation with 5-µM sorafenib for 6 hours). All irradiation doses were single fractions of 6 Gy. Corresponding immunoblot data for the remaining 3 cell lines can be found in Figure S2C.

