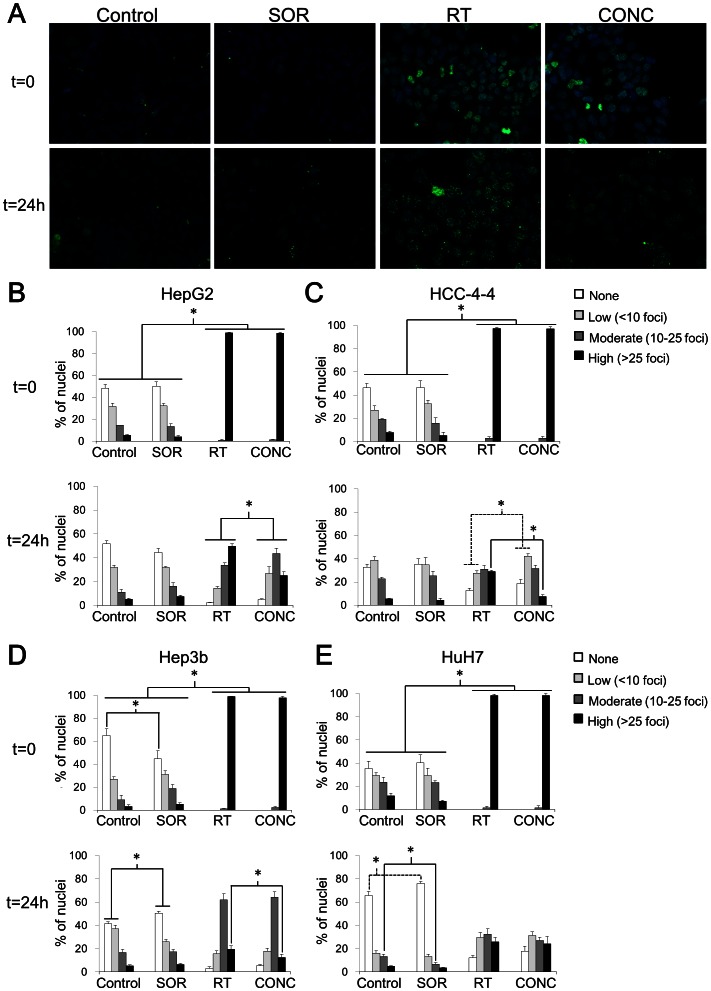
Figure 4. Mechanism of sorafenib-mediated radioprotection.
Immunostaining for γ-H2AX foci, and then staining for DAPI were performed as detailed in Materials and Methods (note: the t = 0 time point actually represents cells that were fixed at 30 minutes post-irradiation). Fluorescent images were captured at 40× using a confocal microscope with uniform exposures of 50 ms for DAPI and 900 ms for Alexa Fluor 488 used for all images. (A) Representative images are shown for the HepG2 cell line at 0 and 24 h for each of the treatment arms. Sample images for the other 3 cell lines are shown in Figure S3. The percent of nuclei demonstrating high (>25), moderate (10–25), low (<10), or no γ-H2AX foci was quantitated for each cell line at each time point by counting at least 5 representative high-power fields (HPF). The results of this quantitation are shown in graphical form with SEM for each treatment arm of each cell line (B–E). For all cell lines, radiation (RT) with or without SOR resulted in a significantly greater percent of nuclei with a high number of foci at t = 0 compared to the non-irradiated SOR and control arms. At t = 24 h, 3 of the 4 cell lines (HepG2, HCC-4-4, Hep3b) demonstrated a significantly greater percent of nuclei with a high number of persistent foci in the RT arm compared to the concurrent RT-SOR (CONC) arm (B–D). The fourth cell line (HuH7) showed no difference in number of nuclei manifesting any level of γ-H2AX foci between the RT and CONC treatment arms (E). Asterisks represent significant differences between treatment arms by Fisher's exact test as indicated by accompanying brackets. Dotted lines are merely included in cases of overlapping brackets to avoid confusion. Cover slips with treated/fixed cells were prepared in triplicate.

