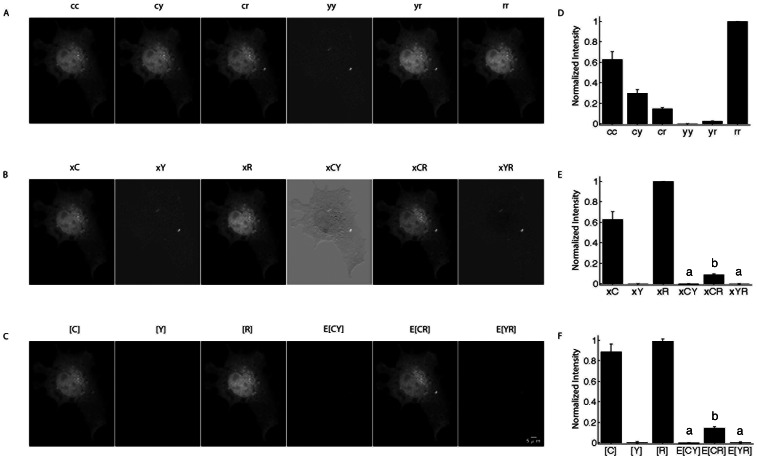
Figure 2. Linear unmixing of FRET amplitudes and N-Way FRET analysis in living cells.
A) Images of live COS7 cells expressing a CFP-RFP linked construct were captured using paired excitation and emission filter combinations (e.g. cc = CFP excitation, CFP emission) to sample the N-Way FRET landscape. D) ROIs to provide the raw intensities from these cells. Unmixing of these images using matrix A recovers the fluorescence abundances (e.g. xC) and showed that FRET could be observed only between CFP and RFP (e.g. xCR) (B, images are scaled independently) and was reproducible over multiple cells (E). C) Quantitative unmixing with N-Way FRET showed that equal abundances of CFP and RFP were present and FRET was observed as E[CR], but no was observed for E[CY] or E[YR] as expected (F). 20 cells per condition; data from Scope 2; bars not connected by the same letter are significantly different (p<0.05) by Tukey HSD post hoc comparison of means; error bars are standard deviation.

