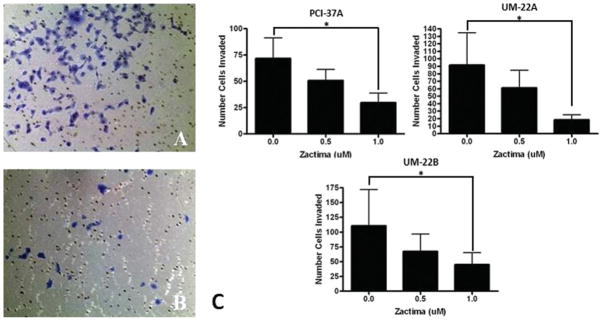
FIGURE 4.

Invasion of HNSCC cell lines after treatment with vandetanib. HNSCC cell were treated with 0.5 μM, 1.0 μM and compared with DMSO control. A matrigel invasion assay was performed; 5 × 10³ cells were plated in each insert. The cells were then fixed and stained and the number of invaded cells were counted and compared with the DMSO treatment group. (A) Representative micrograph of the control matrigel invasion insert of UM-22B (original magnification, ×10). (B) Representative micrograph of the matrigel invasion insert of UM-22B treated with 1 μM of vandetanib (original magnification, ×10). (C) Graph depicting the relative cell count of the treated inserts with respect to the untreated inserts. These data are the repetition of 3 independent experiments. The p values for all cell lines compared with the DMSO control were <0.05 for the 1 μM concentration.
