
Figure 1.
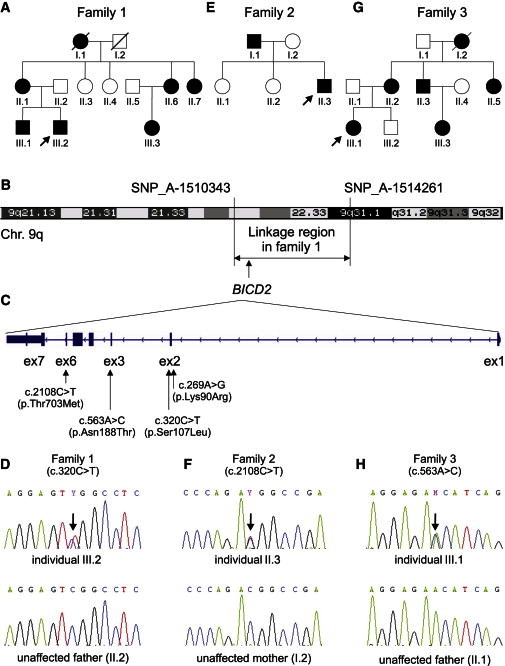
Identified BICD2 Mutations and Their Chromosomal Positions
(A, E, and G) Pedigrees of families 1 (A), 2 (E), and 3 (G).
(B) An ideogram of chromosome 9 shows the linked region and the flanking SNPs identified in family 1.
(C) An ideogram of BICD2 includes exon and intron structure and the identified variants.
(D, F, and H) A sequence of the region includes the mutation and the corresponding region of the unaffected parent in families 1 (D), 2 (F), and 3 (H).