
Figure 4.
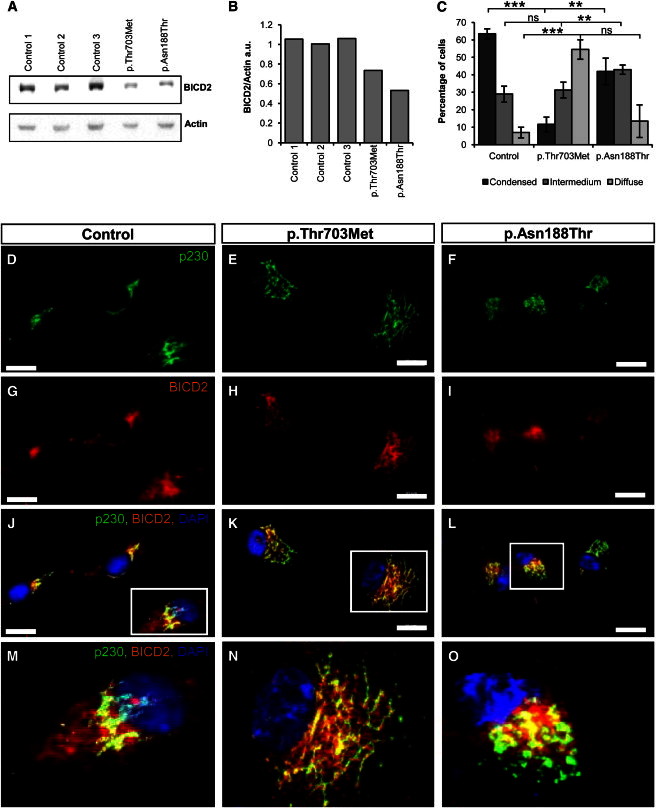
Mutations in BICD2 Cause Severe Golgi Fragmentation in Primary Fibroblasts
(A) Immunoblot analyses of primary-fibroblast proteins of one control cell line and two cell lines derived from affected individuals. The cells were stained with BICD2 and β-actin as a loading control.
(B) Quantification of the immunoblot shows reduced BICD2 levels in fibroblast lines isolated from affected individuals.
(C) Golgi structures, defined as condensed, intermedium, or diffuse in 100 cells of each cell line, were counted in three independent experiments and are given as the mean ± SD. Each quantification was done blindly by two independent persons. Statistical significance is given between controls and each of the two cell lines as ∗∗∗p < 0.001, ∗∗p < 0.01, or ∗p < 0.05. The following abbreviation is used: ns, not significant.
(D–O) Immunostaining of control (D, G, J, and M) and disease (E, F, H, I, K, L, N, and O) fibroblasts with antibodies against trans-Golgi marker p230 in green (1:100, BD Transduction Laboratories) and BICD2 in red (1:200, Sigma), as well as merged pictures, are shown. The nucleus is stained with DAPI in blue. (M), (N), and (O) show magnified insets of single cells from (J), (K), and (L), respectively. Note that compared to control fibroblasts, affected fibroblasts show strongly fragmented Golgi and BICD2 trapped in the Golgi. Scale bars represent 20 μm.