
Figure 3.
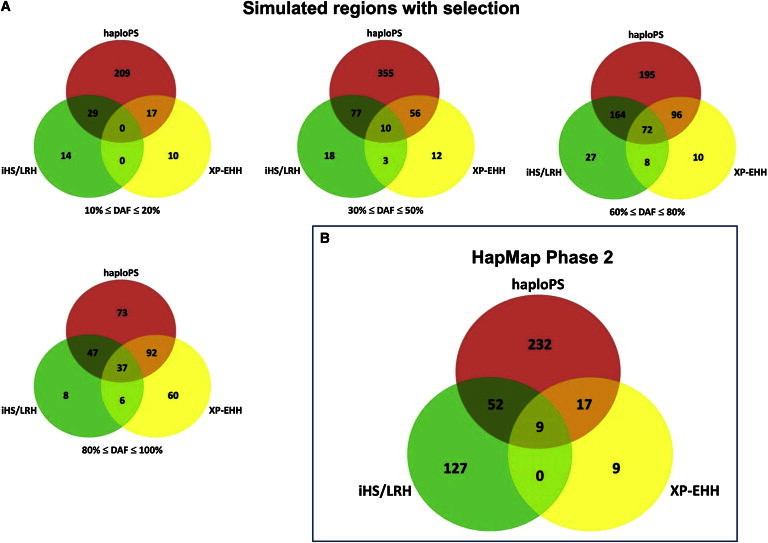
Degree of Overlapping Signals by HaploPS, iHS, and XP-EHH
Positive-selection signals observed by haploPS, iHS, and XP-EHH in (A) the simulation of 2,000 positively selected regions in a population with African ancestry (the results of this simulation are stratified into four frequency bins at 10%–20%, 30%–50%, 60%–80%, and 90%–100%) and (B) the three population panels from Phase II of the International HapMap Project. The numbers found in the overlapping segments of the circles indicate the number of signals that were jointly observed by at least two of the corresponding methods.