
Figure 4.
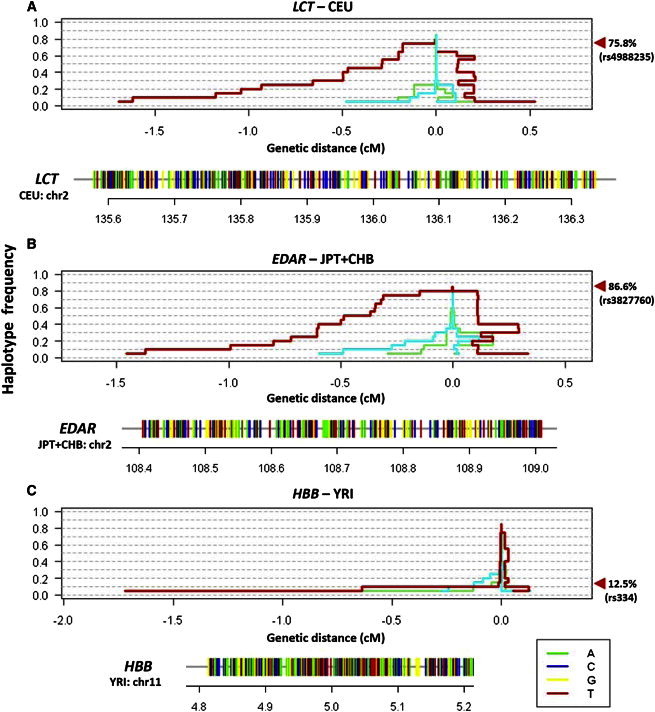
Application of HaploPS at Three Well-Known Positively Selected Loci
HaploPS located positive-selection signals at (A) LCT in Europeans (CEU), (B) EDAR, implicated in hair-follicle development, in East Asians (JPT and CHB), and (C) HBB, containing the sickle cell polymorphism, in Nigerians in West Africa (YRI). For each locus, haploPS additionally located the haplotype form on which the advantageous allele is likely to reside; these haplotypes are represented below each panel as horizontal bars with alleles colored green (adenine), blue (cytosine), yellow (guanine), and red (thymine). HaploPS also provided an estimate for the frequency of the selected allele in its respective population, effectively by locating the frequency that coincides with a significant increase in haplotype length. The red line in each windowed panel illustrates the span of the haplotype around the selected locus at each core frequency, and the other two lines (cyan and lime green) show two examples of the haplotypes spanned at two randomly chosen regions in the genome. The estimated frequencies, with a frequency step size of 5%, for the three loci concurred with those of the derived alleles at the functional polymorphisms (rs4988235 for LCT: estimated 75%, actual 75.8%; rs3822760 for EDAR: estimated 80%, actual 86.6%; and rs334 for YRI: estimated 10%, actual 12.5%).