
Figure 2.
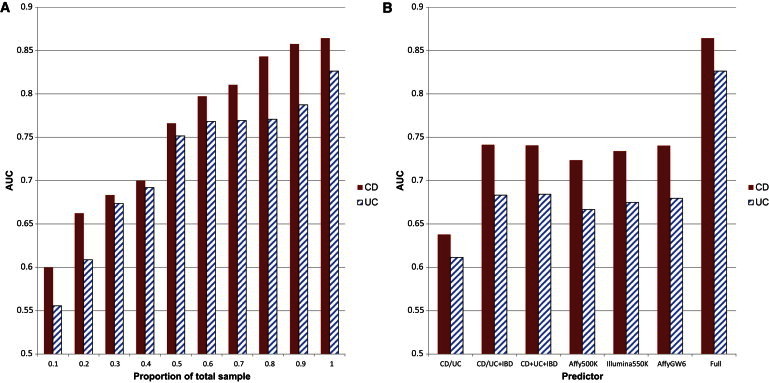
Contribution of Sample Size and Predictors
For all experiments, we trained logistic regression models on fold 2 data and plotted AUCs of testing on fold 3 data.
(A) 10% sample sizes of fold 2 data were 1,327 and 1,197 for CD and UC, respectively.
(B) UC/CD: AUCs were achieved by using only the 30 CD-specific loci or the 23 UC-specific loci; UC/CD + IBD: AUCs were achieved by using the UC or CD loci plus the 110 IBD loci; UC + CD + IBD: AUCs were achieved by using all the 163 IBD loci; Affy500K: AUCs were achieved by using the 1,201/724 CD/UC Immunochip SNPs that are also typed on the Affymetrix 500K chip; Illumina550K: AUCs were achieved by using 1,728/1,142 CD/UC Immunochip SNPs that are also typed on the Illumina 550K chip; AffyGW6: AUCs were achieved by using 1,933/1,204 CD/UC Immunochip SNPs that are also typed on Affymetrix Genome-Wide SNP Array 6.0 chip; full: AUCs were achieved by using all Immunochip SNPs.