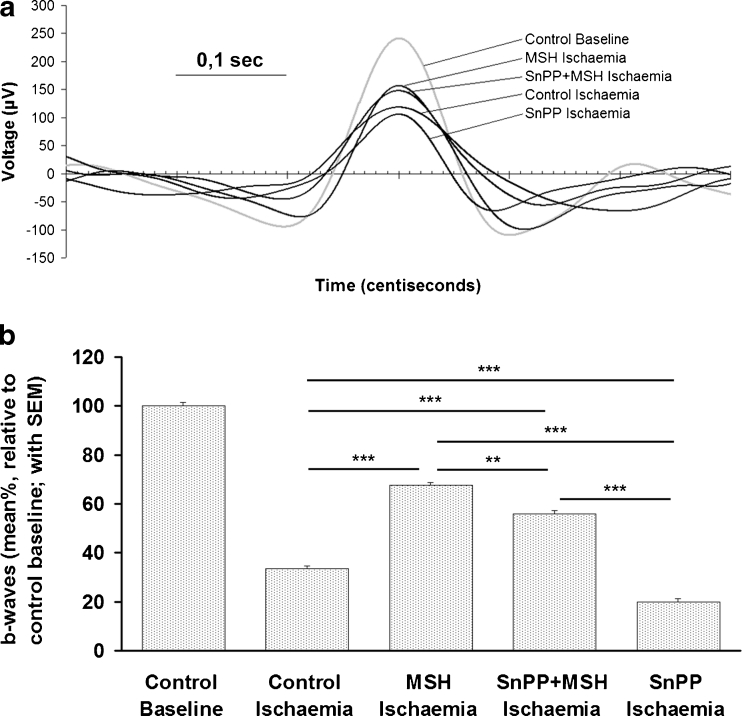
Fig. 6.
Effects of SnPP and post-ischemic α-MSH treatment on ERG voltage profiles (a) and ERG b-waves (b) obtained in part II experiments (group II). Results are shown for five groups including: nonischemic retinas from vehicle-treated rats (Control Baseline) and I/R-injured retinas from vehicle- (Control Ischemia), α-MSH- (MSH Ischemia), SnPP + α-MSH- (SnPP + MSH Ischemia), and SnPP-treated rats (SnPP Ischemia). Shown on (a) are representative ERG spikes; shown on (b) are mean percentage values (relative to control baseline) for b waves measured in electroretinograms of the aforementioned groups. Horizontal lines indicate comparisons. The significance of comparisons is indicated as follows: ns not significant; *p < 0.05; **p < 0.01; ***p < 0.001

