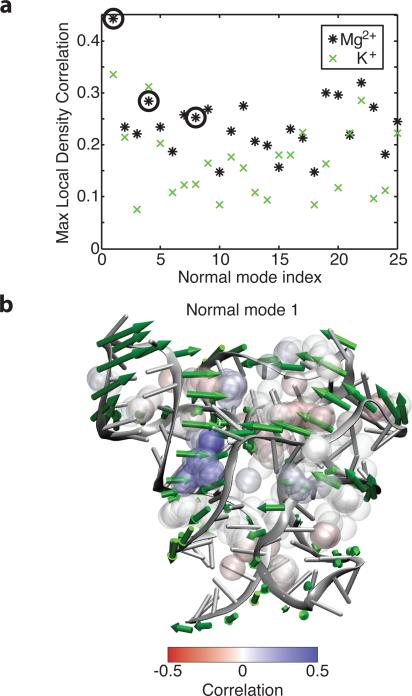
Figure 4.
Mg2+ association and resulting local bridging interactions also affect the global RNA conformation. (a) Correlations between normal mode projections and the most strongly correlated local Mg2+ density for each normal mode. Several of the first few normal modes are strongly correlated. Circled modes are shown in (b) and in Figure S5. The positive direction of motion along the normal mode is plotted as green arrows. Densities in regions which close upon positive motion along the normal mode are generally positively correlated (blue), while densities in regions which open are generally negatively correlated (red). We note that in the case of the P4 major groove described earlier, positive motion along the normal mode corresponds to a decrease in P-P distance. Thus, a negative correlation between the Mg2+ density and the P-P distance corresponds to a positive correlation between the Mg2+ density and positive motion along the normal mode. Balls represent association sites, and are plotted one quarter scale as in Figure 3.

