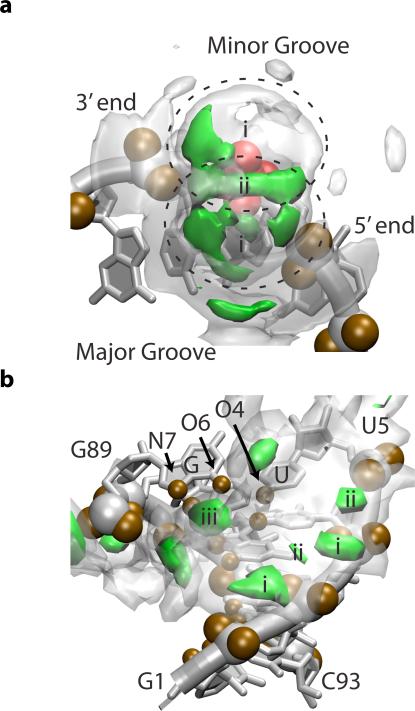
Figure 7.
Spatial distribution functions (SDF) of Mg2+ about SAM-I. In our study, simulations were performed with 0 mM, 1 mM, 6 mM and 10 mM magnesium concentration. Here, we show magnesium density isosurfaces, displaying localized regions of high magnesium concentration. Specifically, Mg2+ density surfaces of 1.4 M and 7 M are shown in transparent white and solid green respectively (10 mM simulation with SAM). The density of the outer-sphere Mg2+ distribution is expressed in molarity to highlight the more than 700-fold enrichment of Mg2+ above the bulk concentration of 10 mM. See SI Section 8 for more details. (a) The average Mg2+ SDF about a phosphate (red). A representative backbone is shown for reference. Several hydration layers and a preference for the major groove are visible. Regions (i) and (ii) correspond to the two peaks in Figure 6a (b) The Mg2+ SDF about helix P1. Electronegative atoms controlling the distribution are labeled and shown in brown. Sites occur along the backbone (i&ii) or within the major groove near the brown electronegative atoms (iii).

