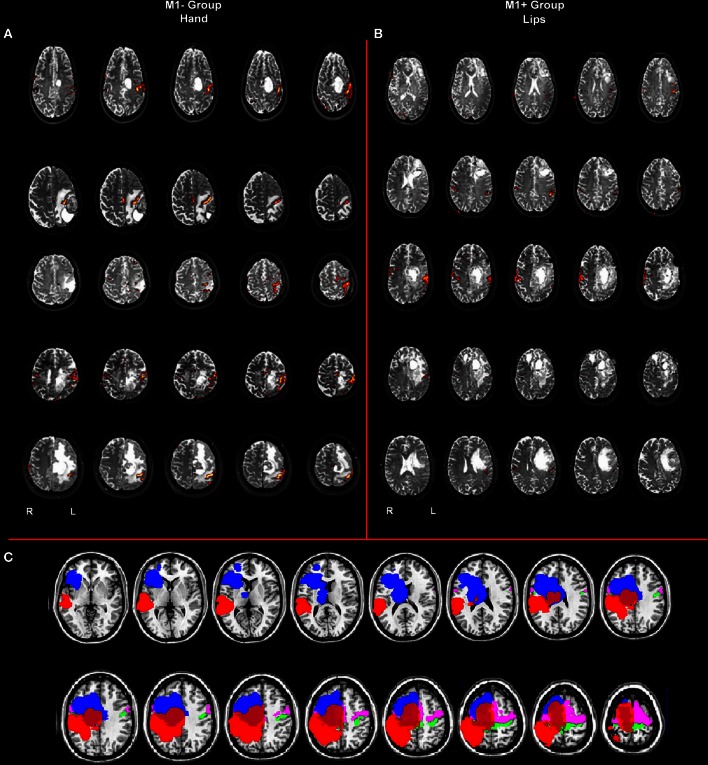
Figure 1.
(A) Whole brain analysis results for the group of patients with lesions involving M1 (M1−) performing hand clenching movements vs. rest and (B) activation maps for the group of patients with lesions sparing M1 (M1+) performing lip movements vs. rest. The two types of movement have been selected in this image to highlight the close location of the M1− to the hand representation area, as evidenced by the activation cluster, and the vicinity of the M1+ to the lip representation area, as evidenced by the activation cluster. Data were thresholded at p < 0.05 cluster corrected (Z > 2.3). (C) Overlapping of the ROIs drawn on the patients' lesions after normalization (in blue for the M1+ and in red for the M1−) and of the mask created by using the Anatomy Toolbox and the maximum probability maps (MPS) of the left and right M1 (in green) and of the left and right Pm cortex (in pink).

