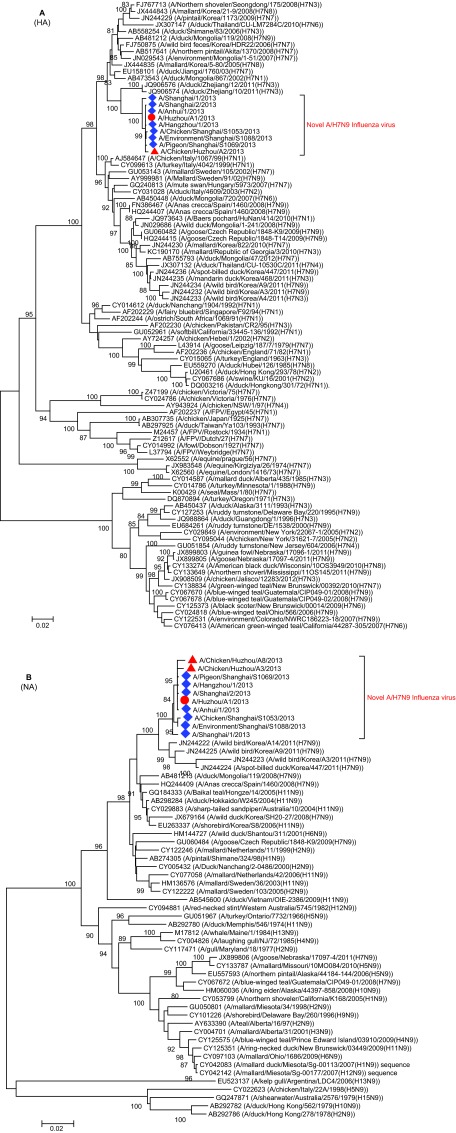
Figure 2.
Phylogenetic tree of influenza HA (A) and NA (B) sequences. The phylogenetic trees were constructed with MEGA 5.0 using the neighbor-joining method. The stability of the nodes was assessed by bootstrap analysis with 1000 replications, and only bootstrap values of ≥80 were shown at the corresponding nodes. The sequences from this patient and the poultry in Huzhou are highlighted by red circle and triangles, respectively. The blue diamonds indicate the sequences of A/H7N9 viruses from other regions of China.

